News Releases
Large-Scale Office Building Supply Survey for Tokyo’s 23 Wards 2026 Despite a high supply in 2026 and 2029, supply will tend to be constrained for the next 5 years
- Offices


Mori Trust Co., Ltd. announces the latest survey results on large-scale office buildings supply trends in Tokyo’s 23 wards. We have surveyed large-scale office building supply since 1986 and have surveyed and analyzed medium-scale office building supply trends annually since 2013.
“ Large-Scale Office Building Supply Survey for Tokyo’s 23 Wards ” Survey Content
Surveyed area: 23 Wards of Tokyo
Surveyed buildings: Large-scale office buildings (office floor area* of at least 10,000 m2)
Medium-scale office buildings (office floor area* of 5,000 m2 to under 10,000 m2)
*Total floor area excluding non-office use in the case of mixed-use buildings with retail, residences, hotels, etc.
Key points of the survey results
(Survey Date: December 2025) *The “Detailed Report” can be found starting on Page 5.
1. Trends in Supply Volume
The supply of large-scale office buildings for the 23 Wards of Tokyo in 2025 was 1.13 million m2 (176% year-on-year increase).
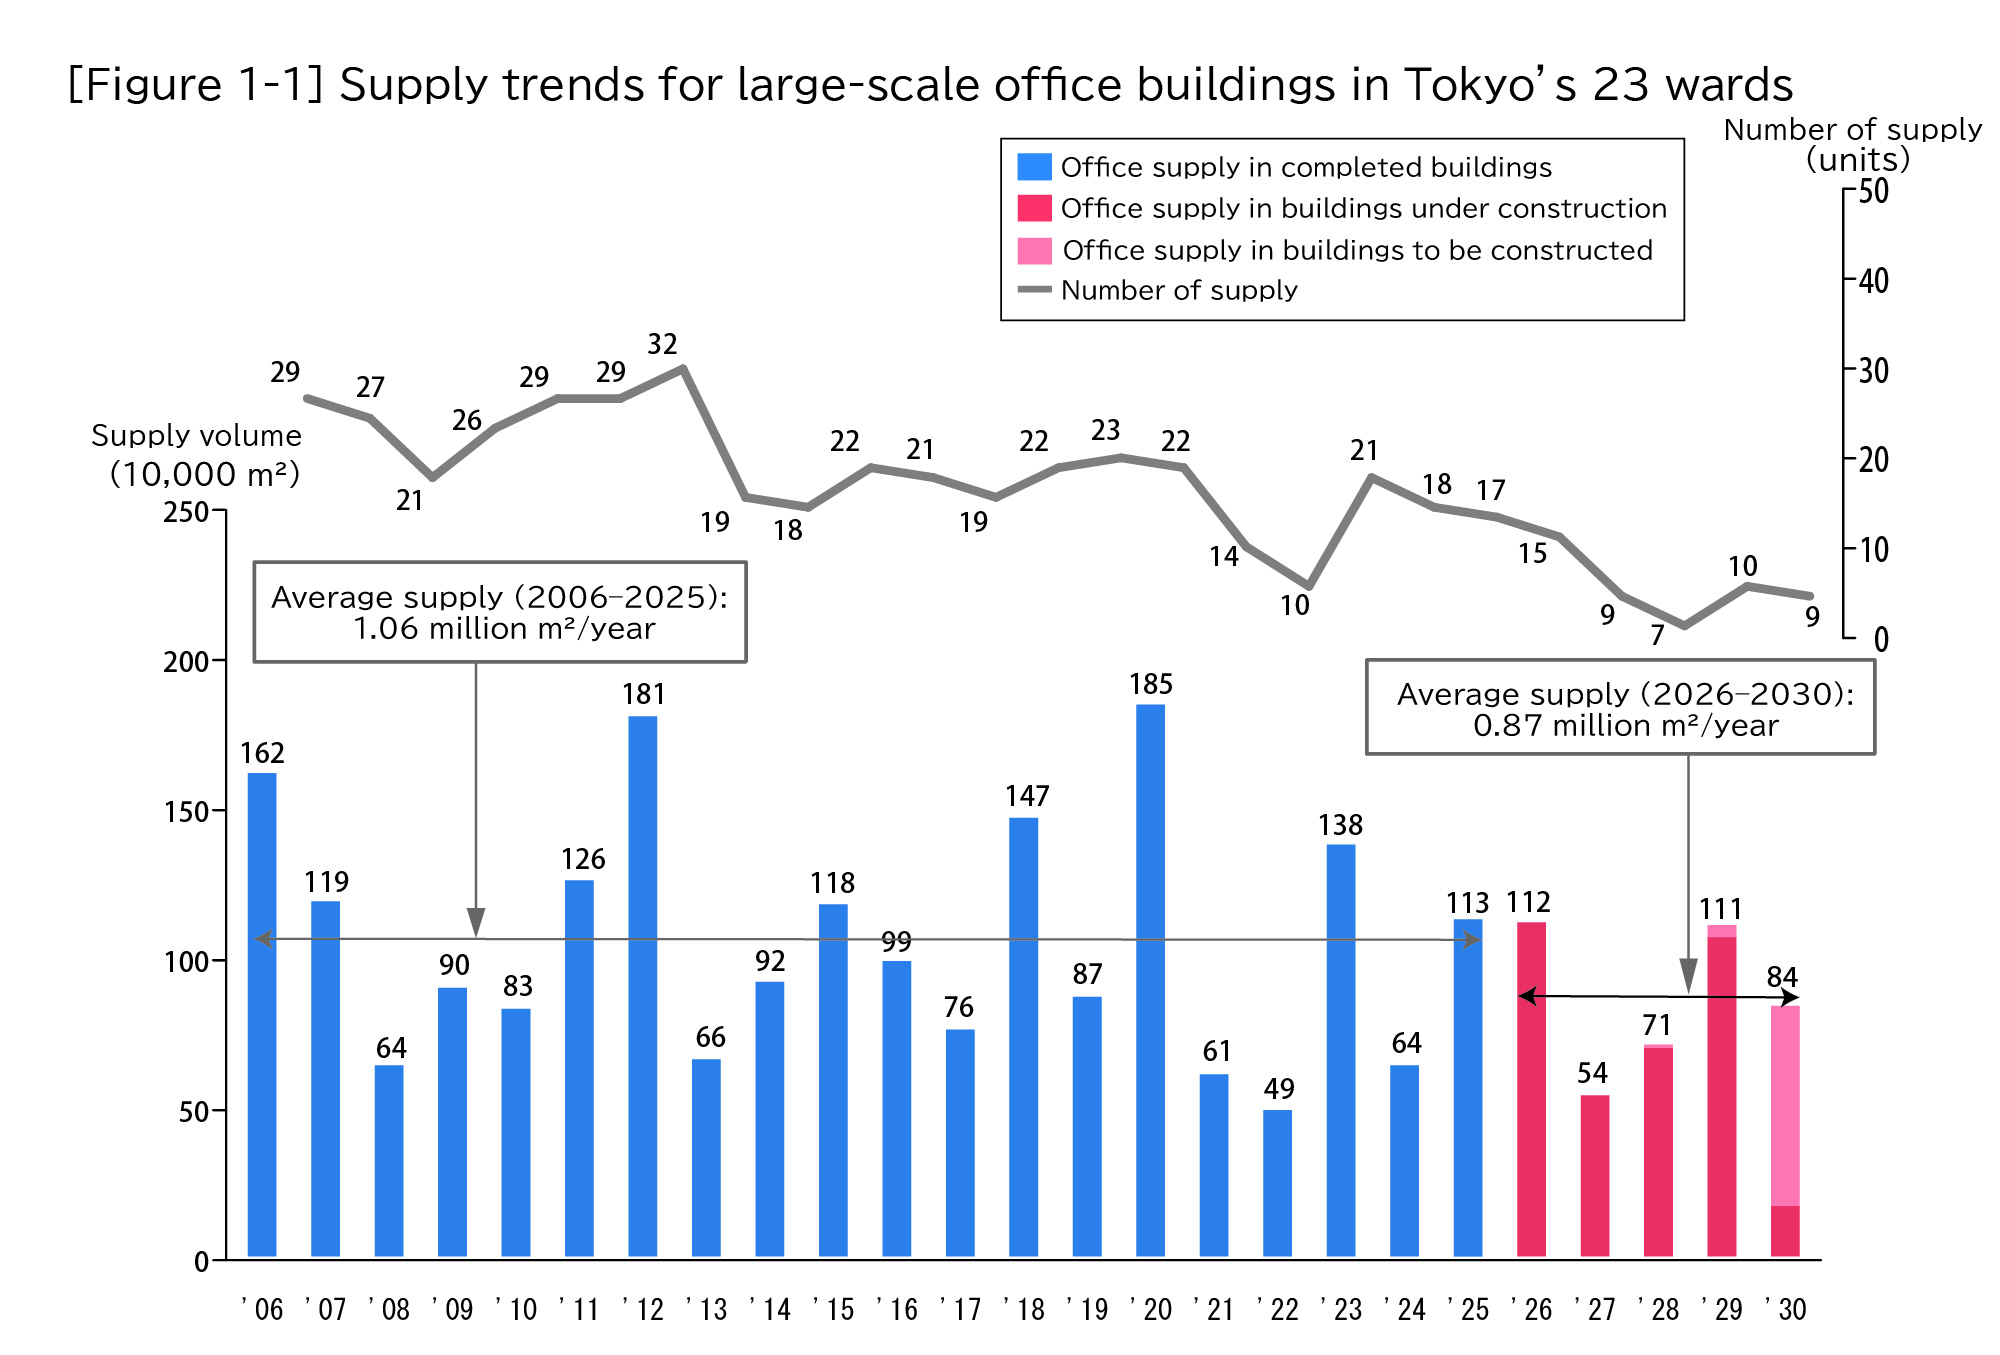
Although supply for 2026 and 2029 is expected to remain on par with 2025, average supply over the next five years starting in 2026 is only expected to reach 870,000 m2 (77% of the average over the past 20 years).
2. Trends in Supply Areas
Compared with the past five years, supply over the next five years is expected to increasingly concentrate in the three central wards of Tokyo (Chiyoda, Chuo, and Minato wards). The supply ratio for Chiyoda and Chuo wards is expected to see particular growth.
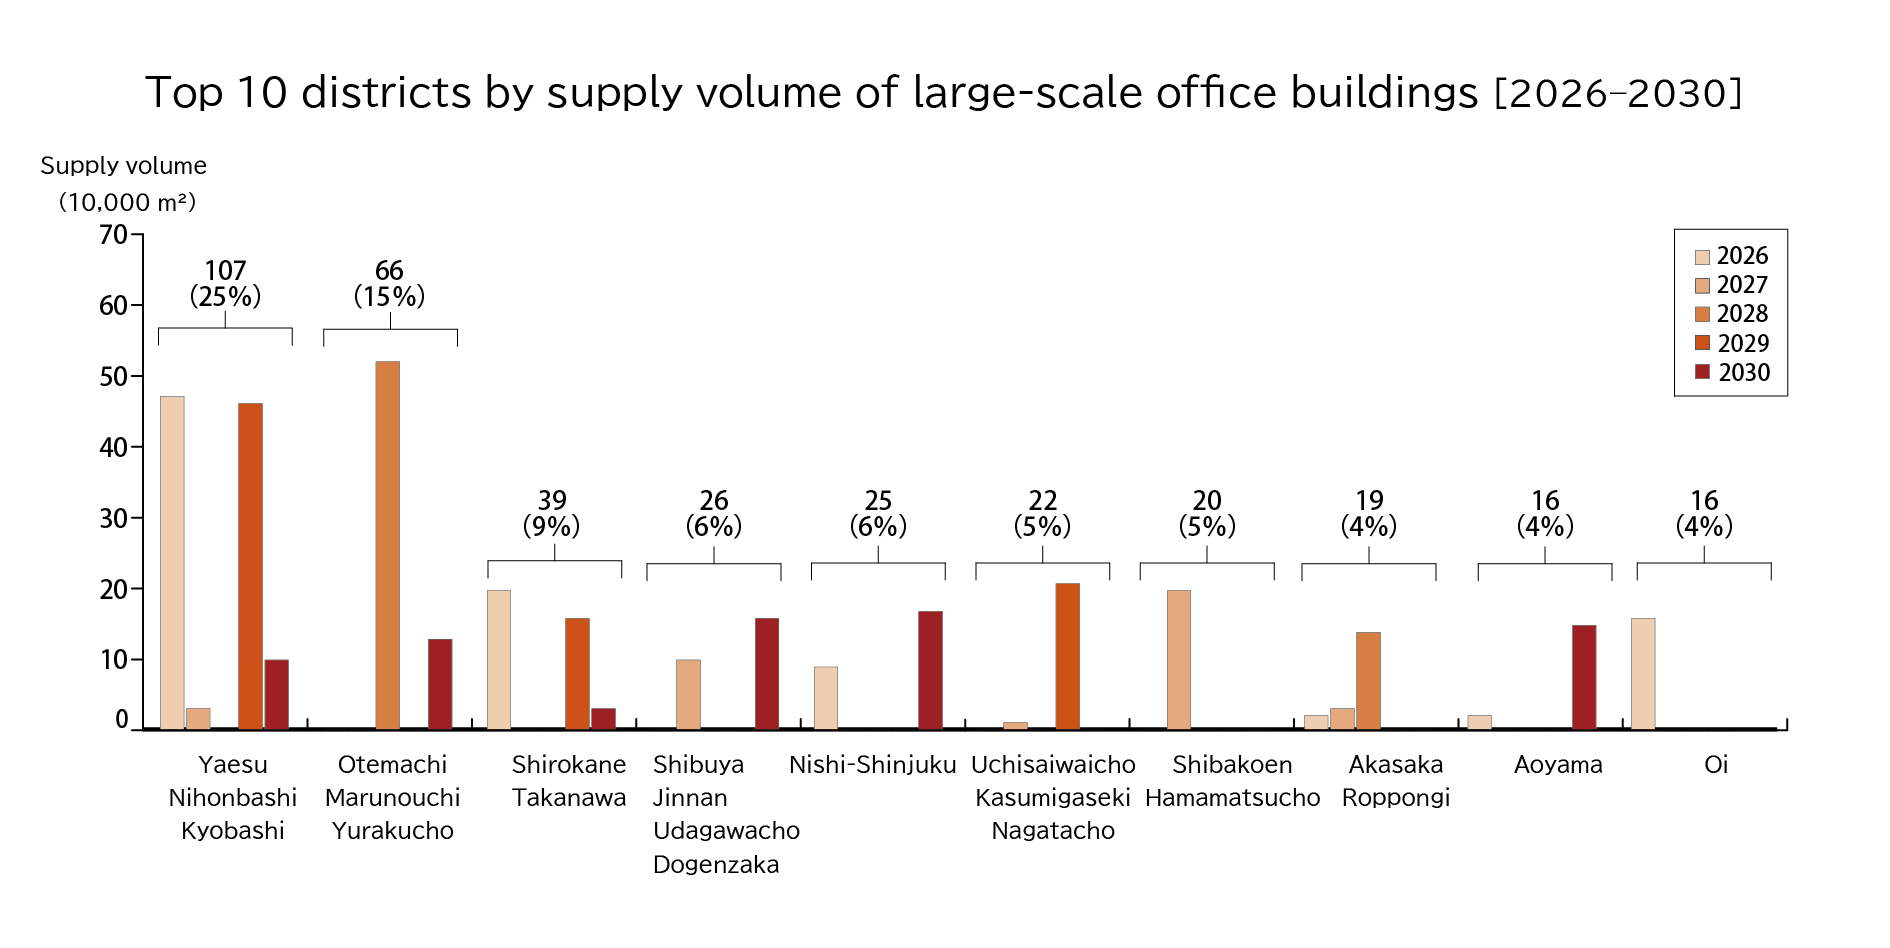
In terms of totals by district, over the past five years supply was centered in Toranomon/Shinbashi and Yaesu/Nihonbashi/Kyobashi. While supply in Yaesu/Nihonbashi/Kyobashi will remain high over the next five years, several areas that had seen limited supply over the past five years, including Uchisaiwaicho/Kasumigaseki/Nagatacho, Nishi-Shinjuku, Aoyama, and Oi, newly entered the top ten, leading to an outlook for diversification in development areas.
3. Supply Trends by Development Site
In the three central wards of Tokyo, the ratio of “underutilized or unused land (redevelopment, etc.)” will increase from 30% from 2016 to 2020 to 70% from 2026 to 2030, resulting in a shift in the focus of development sites from “reconstruction” to “underutilized or unused land (redevelopment, etc.).” Outside the three central wards of Tokyo, “underutilized or unused land (redevelopment, etc.)” was continuously the main focus of development from 2016 and 2020, and beyond. (See below for definitions of “reconstruction” and “underutilized or unused land (redevelopment, etc.)”)
4. Supply Trends of Medium-sized Office Buildings
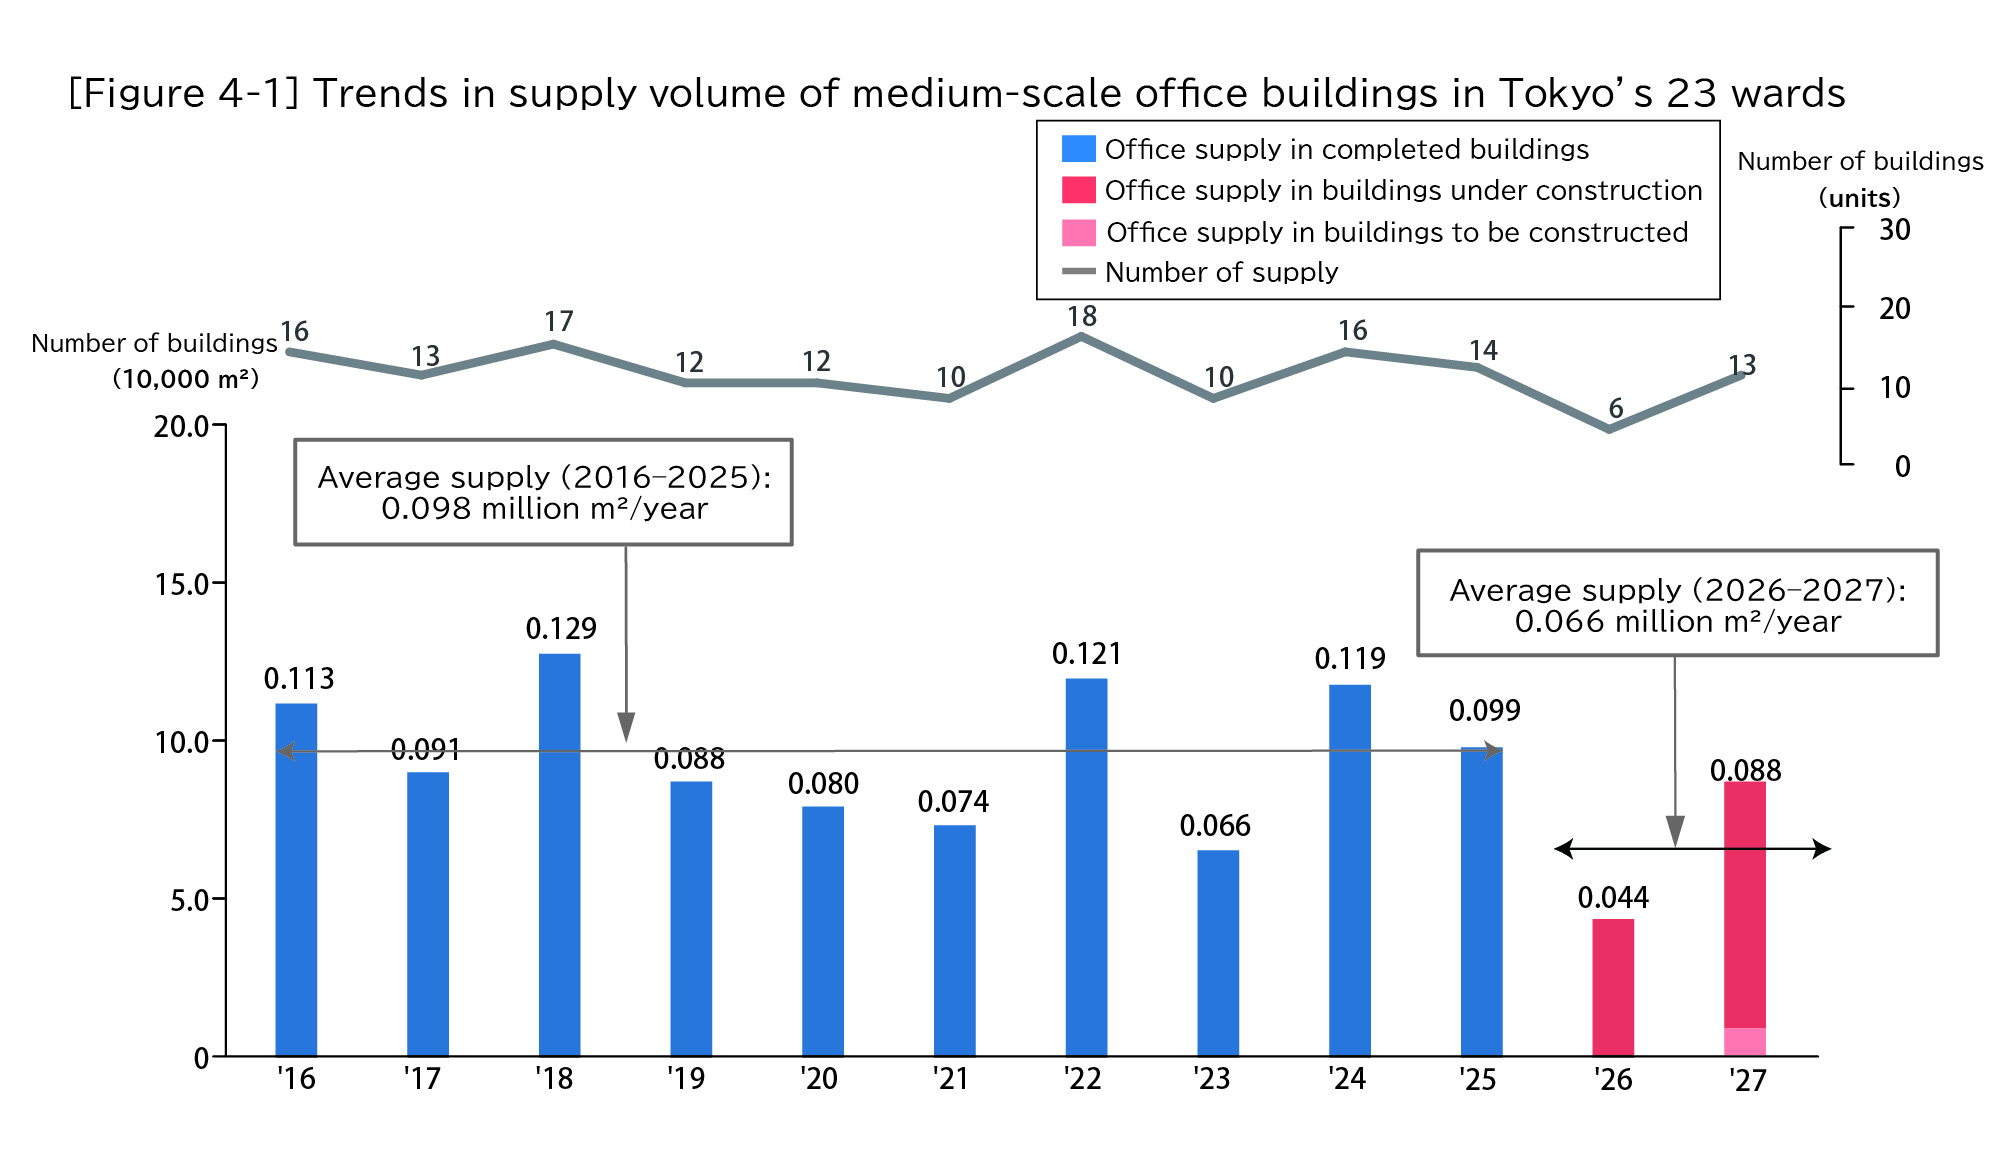
The supply of medium-scale office buildings in 2025 was 99,000 m2, equivalent to the average supply of 98,000 m2 over the past 10 years. In 2026, supply will decrease to 44,000 m2, while the average supply over the next two years will reach 66,000 m2, less than the average over the past 10 years. In 2027, supply is expected to increase again to 88,000 m2.
Summary
■Future supply will tend to be constrained. The speed of vacancy clearance will accelerate.
In 2025, supply was high, exceeding 1 million m2. Supply for 2026 and 2029 is expected to remain at the same level, whereas average supply over the next five years is expected to fall below the average for the past 20 years, leading to a trend toward supply constraint.
Future supply constraints are assumed to stem from the longer construction periods and revised construction plans coinciding with rising construction costs. Factors driving up construction costs include structural and irreversible issues such as labor shortages. As this trend is likely to be prolonged, the future is unlikely to see a significant increase in supply.
On the other hand, demand is growing strongly. According to a survey conducted by Mori Trust, the rate of tentative contracts for new buildings stood above 95% for properties completed in 2025, approximately 80% for those to be completed in 2026, and over 50% for those to be completed in 2027, indicating a high pace of vacancy clearance. In particular, even in 2025 and 2026, when supply continued to exceed 1 million m2, vacancies were steadily absorbed, confirming robust tenant demand. As a result of this progress in vacancy clearance, rents have mainly continued to trend upward for new buildings, which has also had an affect on existing buildings.
One of the reasons behind the rise in demand is the growing tendency toward return-to-the-office work, which has continued since the COVID-19 pandemic subsided. The growing reaffirmation regarding the value of face-to-face communication and the increase in the number of companies requiring higher frequency of in-person attendance have led to the emergence of a movement toward larger offices. In addition, intensifying competition for human resources is assumed to be expanding the number of firms that regard possession of offices in high-quality buildings as an investment for corporate growth, driving more enterprises to relocate to new properties.
In this way, both occupancy rates and rents continue to trend upward, meaning the market is expected to remain firm for the time being. Although demand may fluctuate to a certain degree depending on the external environment going forward, supply will tend to be constrained for at least the next five years. Even when considering fluctuations in demand, however, this is still assumed to mean excess supply is unlikely.
■Existing properties are increasing in value. Signs of a change in the relationship between occupancy rates and rents have emerged.
When the supply of new buildings is limited, existing properties gain in relative importance among the overall stock. In particular, new properties that have been completed in recent years are expected to maintain high competitiveness because their facility specifications and amenities are often comparable to those of new properties with the latest specifications. In addition, even among older properties, those that have been renovated to increase their value are similarly gaining in presence and are therefore expected to become increasingly important as a destination for tenants seeking high-value-added offices.
Against the backdrop of supply constraints and entrenched inflation, some properties have begun to show an unusual trend in the relationship between occupancy rates and rents. In the past, rent hikes were assumed to begin in earnest when occupancy approached full capacity. Recently, however, some properties have raised rents even when the occupancy rate is not necessarily high. This trend is considered to be a manifestation of a shift to a Tokyo office rental market phase in which landlords are beginning to emphasize rent levels over occupancy rates. At present, this trend is mainly seen in new properties, but it may affect existing properties in the future.
“Large-Scale Office Building Supply Survey for Tokyo’s 23 Wards ” Detailed Report
1. Trends in Supply Volume
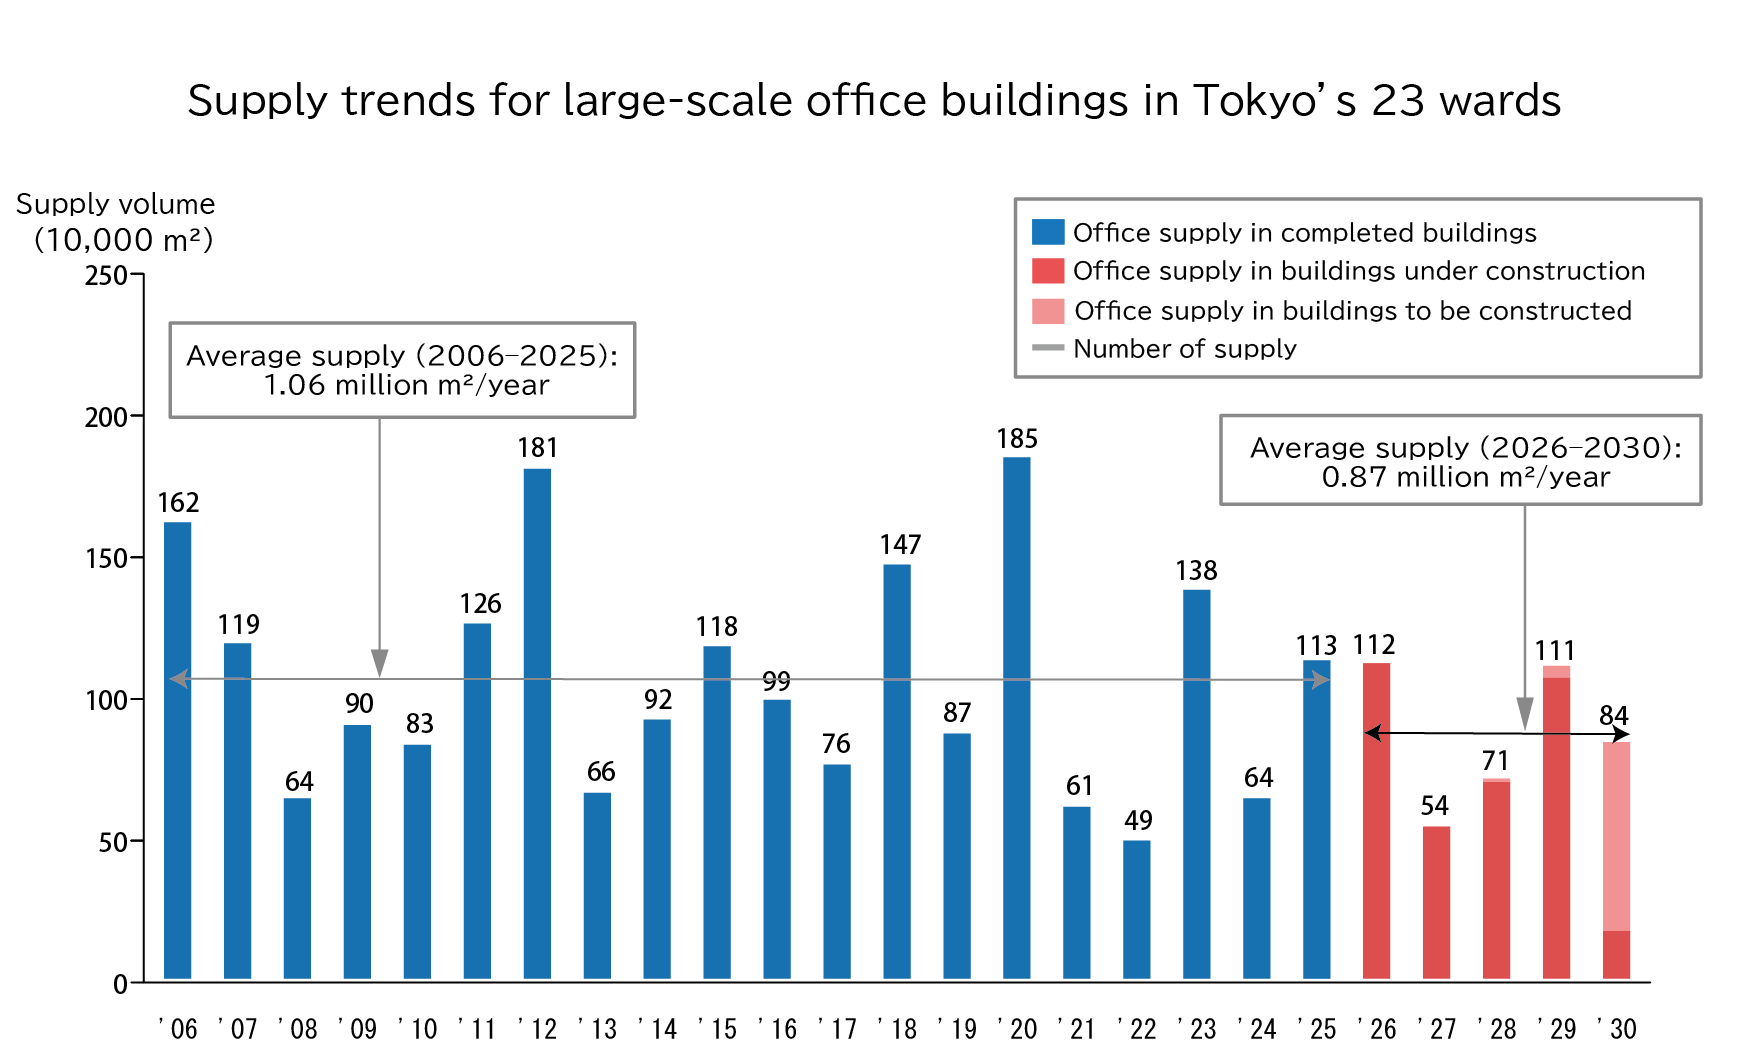
The supply of large-scale office buildings in the 23 Wards of Tokyo in 2025 was 1.13 million m2, substantially above the 640,000 m2 of the previous year.
Looking at supply for the five-year period from 2026 on, supply in 2026 and 2029 is expected to remain on par with 2025, whereas average supply over the next five years is expected to only reach 870,000 m2, well below the average supply of 1.06 million m2 for the past 20 years, due to tighter supply in 2027, 2028, and 2030. The future five-year average supply will continue to fall below average supply for the past 20 years. [Figure 1-1]
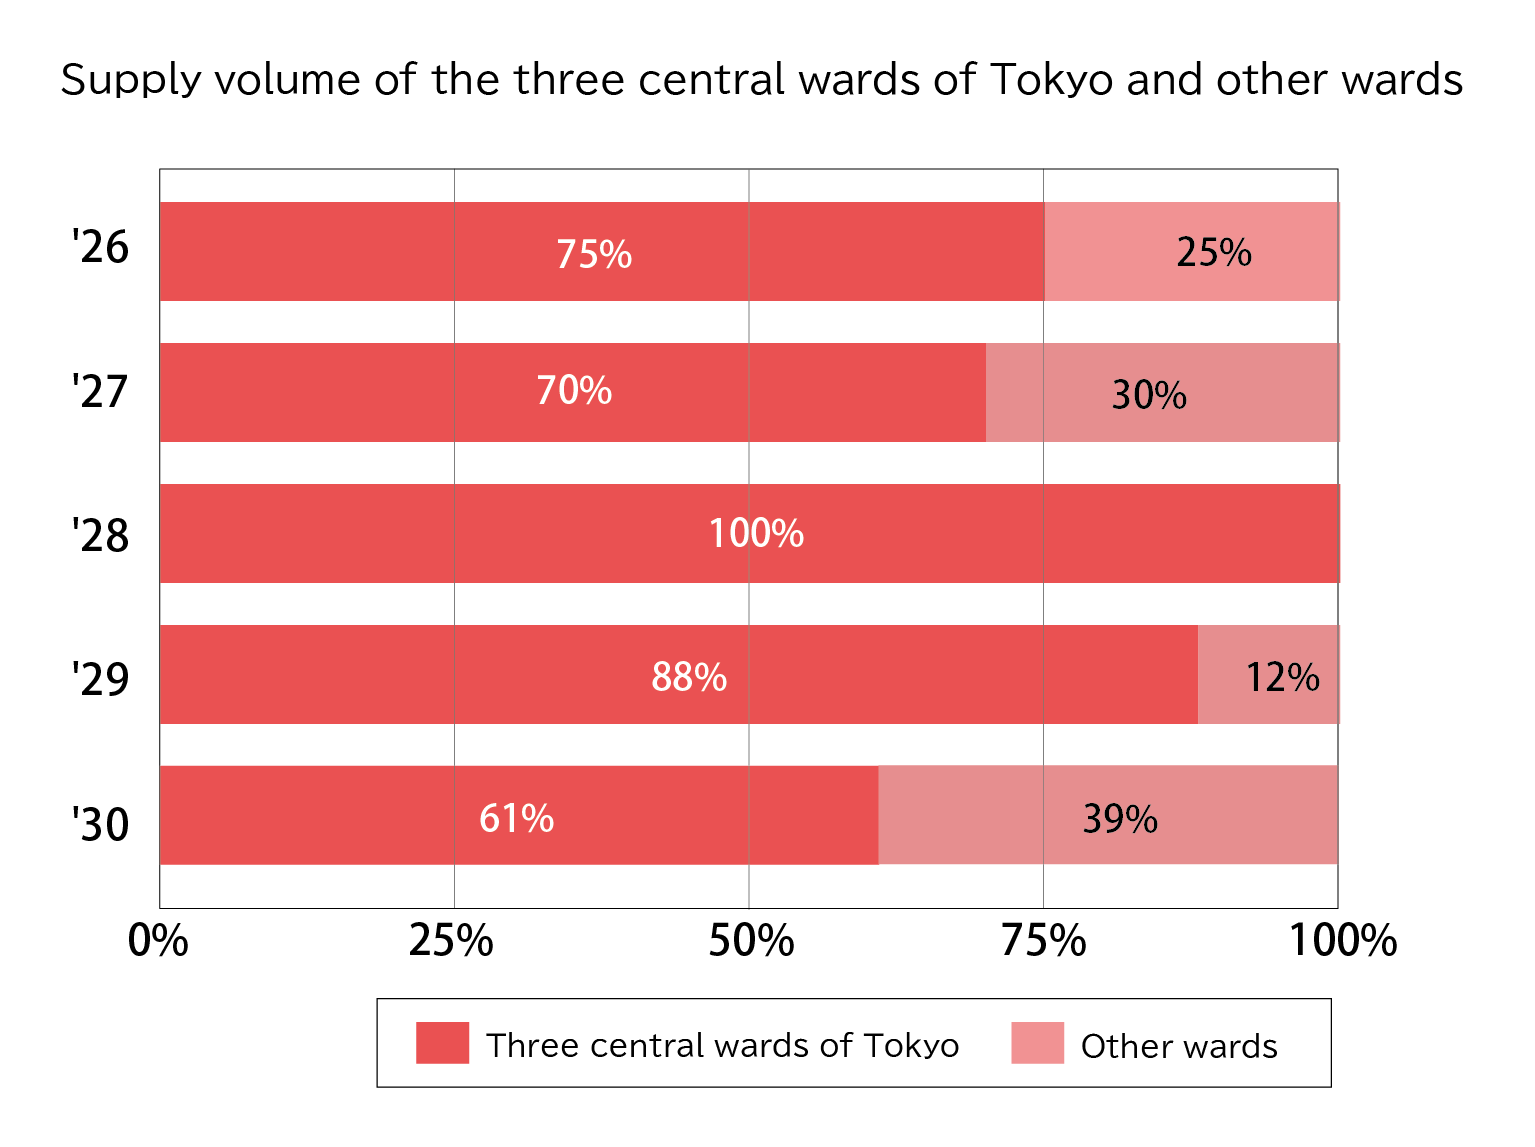
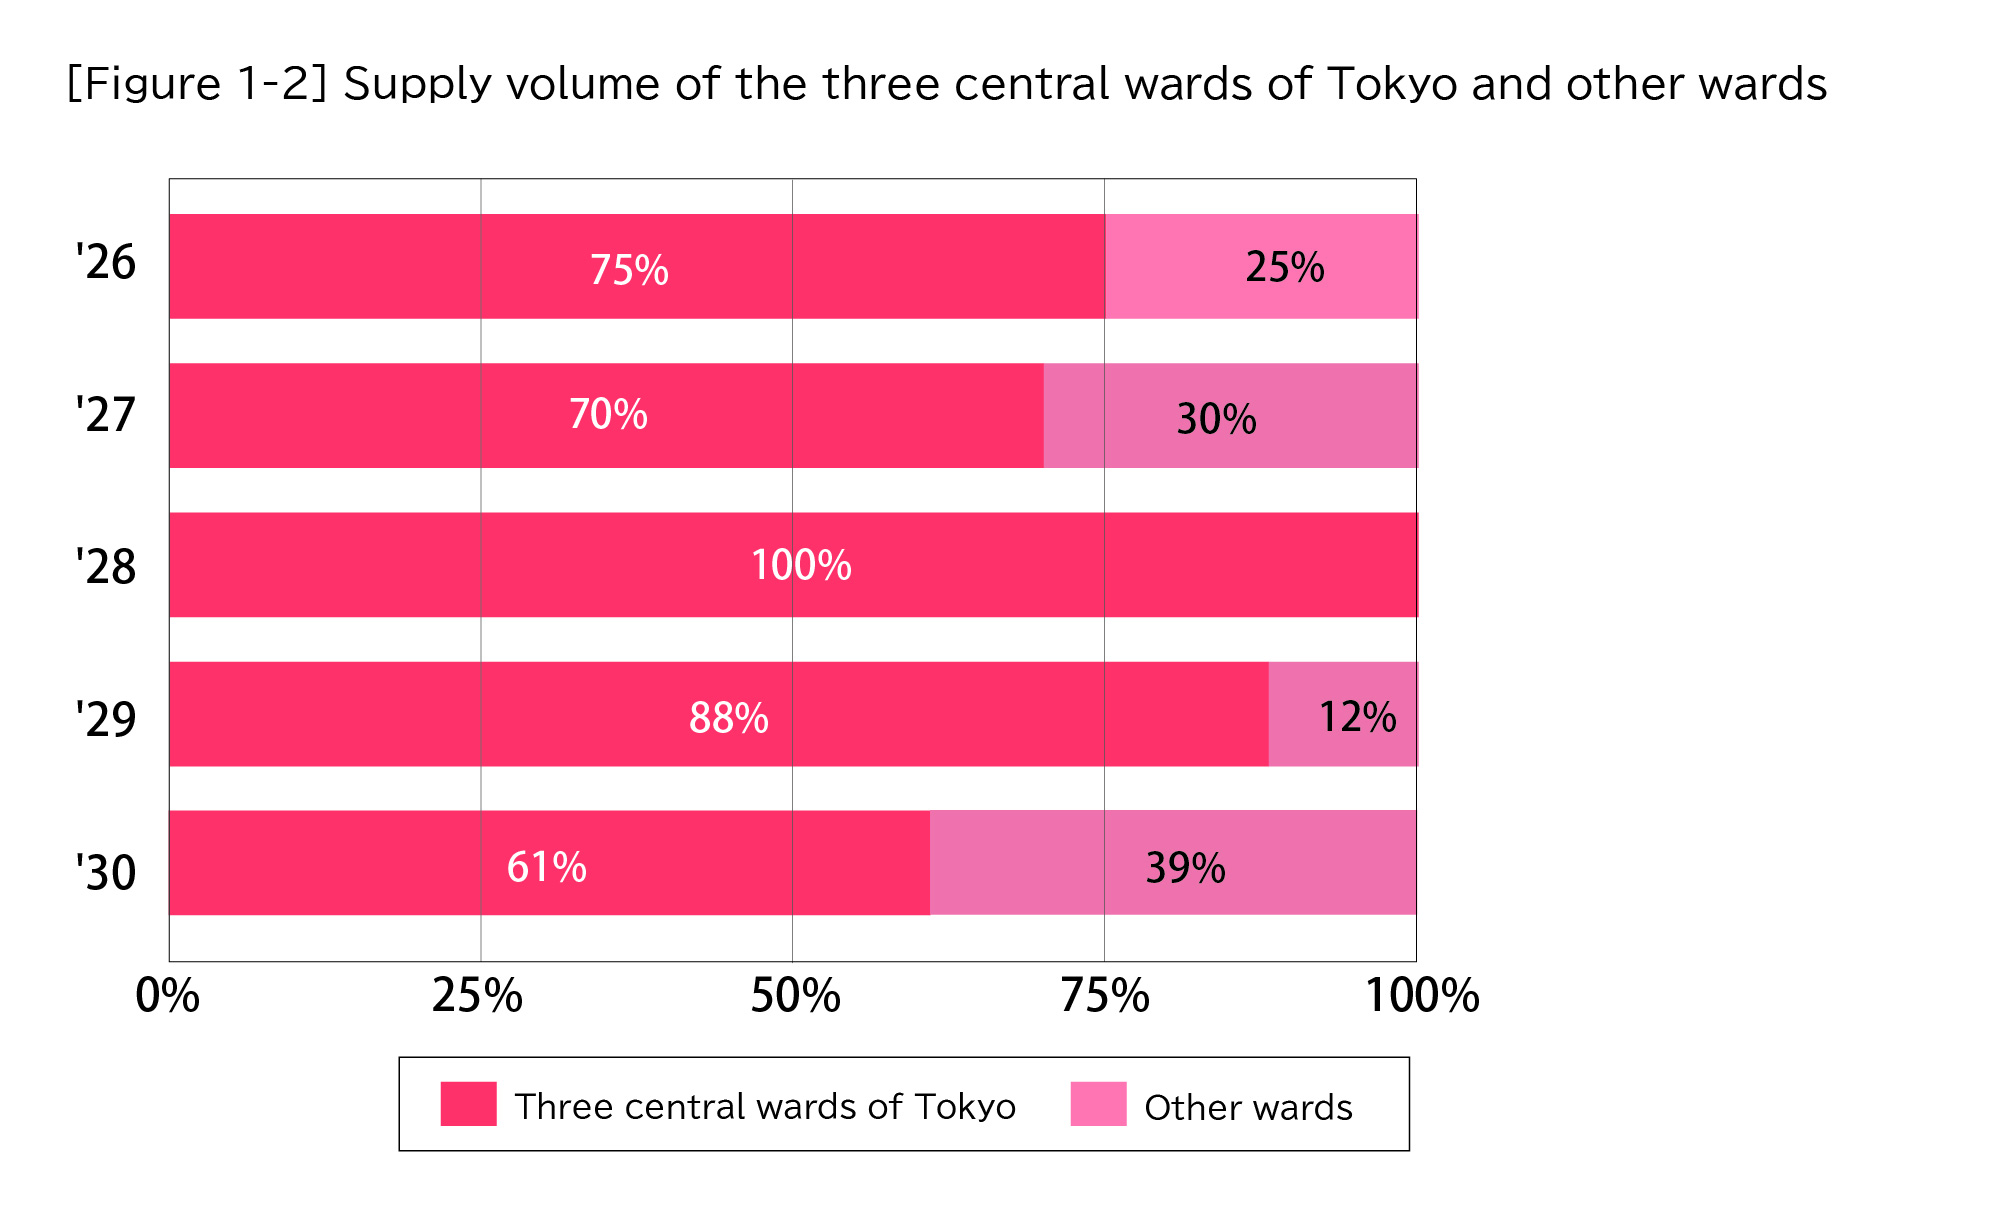
When supply is aggregated by ward and separated between the three central wards of Tokyo and other wards to calculate the supply ratio, the ratio for the three central wards of Tokyo stands at around 70% for 2026 and 2027. Although this ratio rises to 100% in 2028 and nearly 90% in 2029, it only reaches 60% in 2030, indicating a recovery in supply from areas outside these three wards. [Figure 1-2]
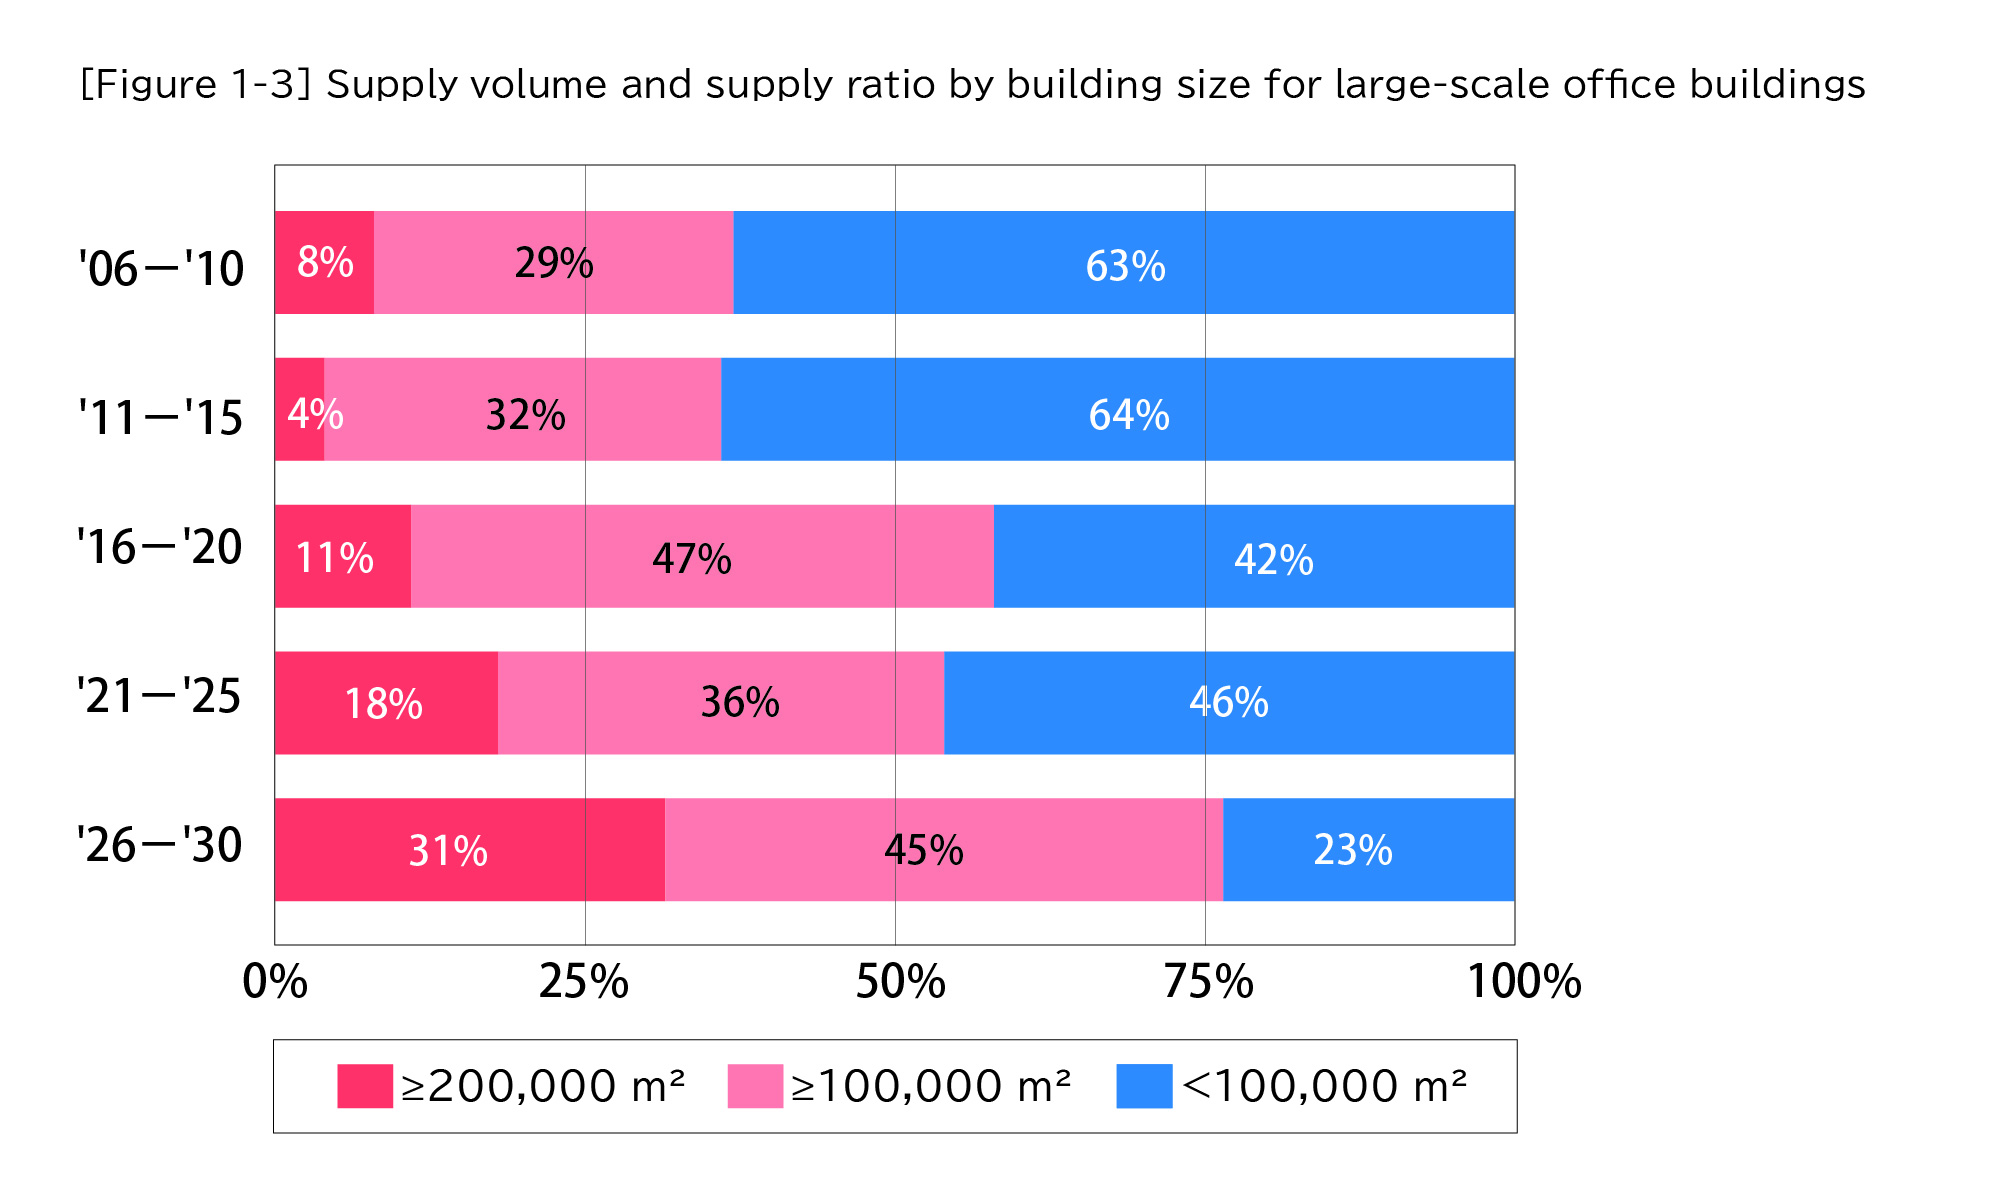
When the supply of large-scale office buildings is aggregated by size on the basis of five-year periods and tracked, buildings with a total office floor area of less than 100,000 m2 accounted for more than 60% of supply in the periods from 2006 to 2010 and from 2011 to 2015, making these the main source of supply. However, from 2016 to 2020 and from 2021 to 2025, the ratio of office buildings of this size declined to around 40%, while the ratio of super-large-scale office buildings exceeding 200,000 m2 increased. From 2026 to 2030, the ratio of buildings larger than 200,000 m2 will increase to 30%, exceeding that of buildings smaller than 100,000 m2. Therefore, the trend toward super-large-scale office buildings is expected to further strengthen in the future. [Figure 1-3]
2. Trends in Supply Areas
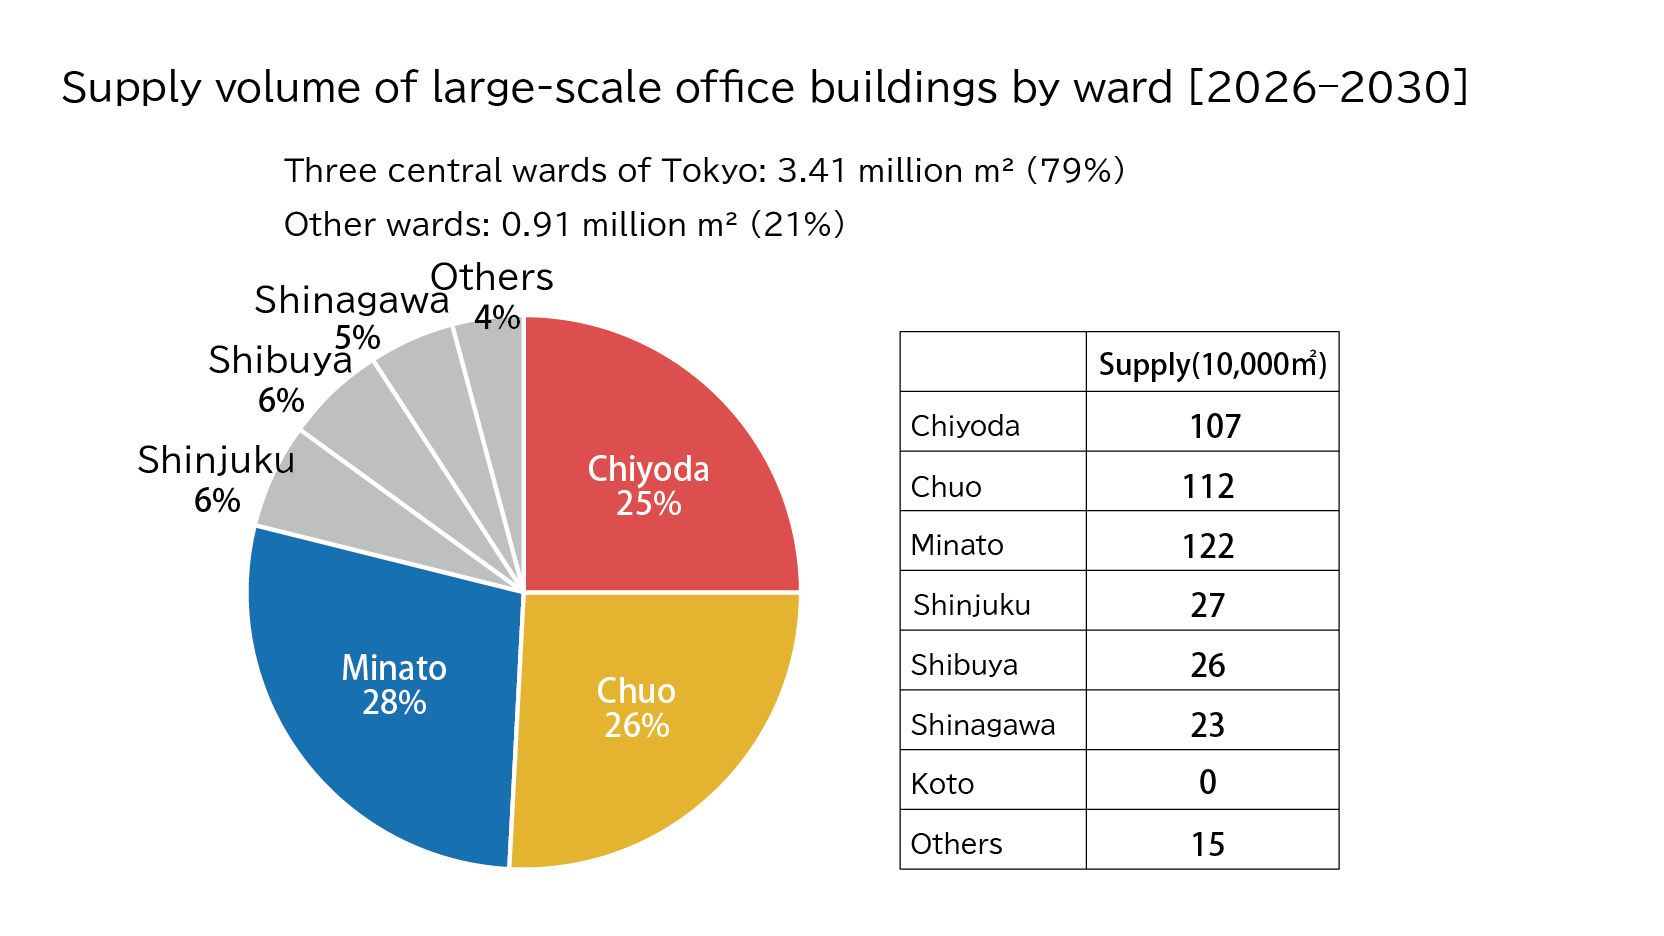
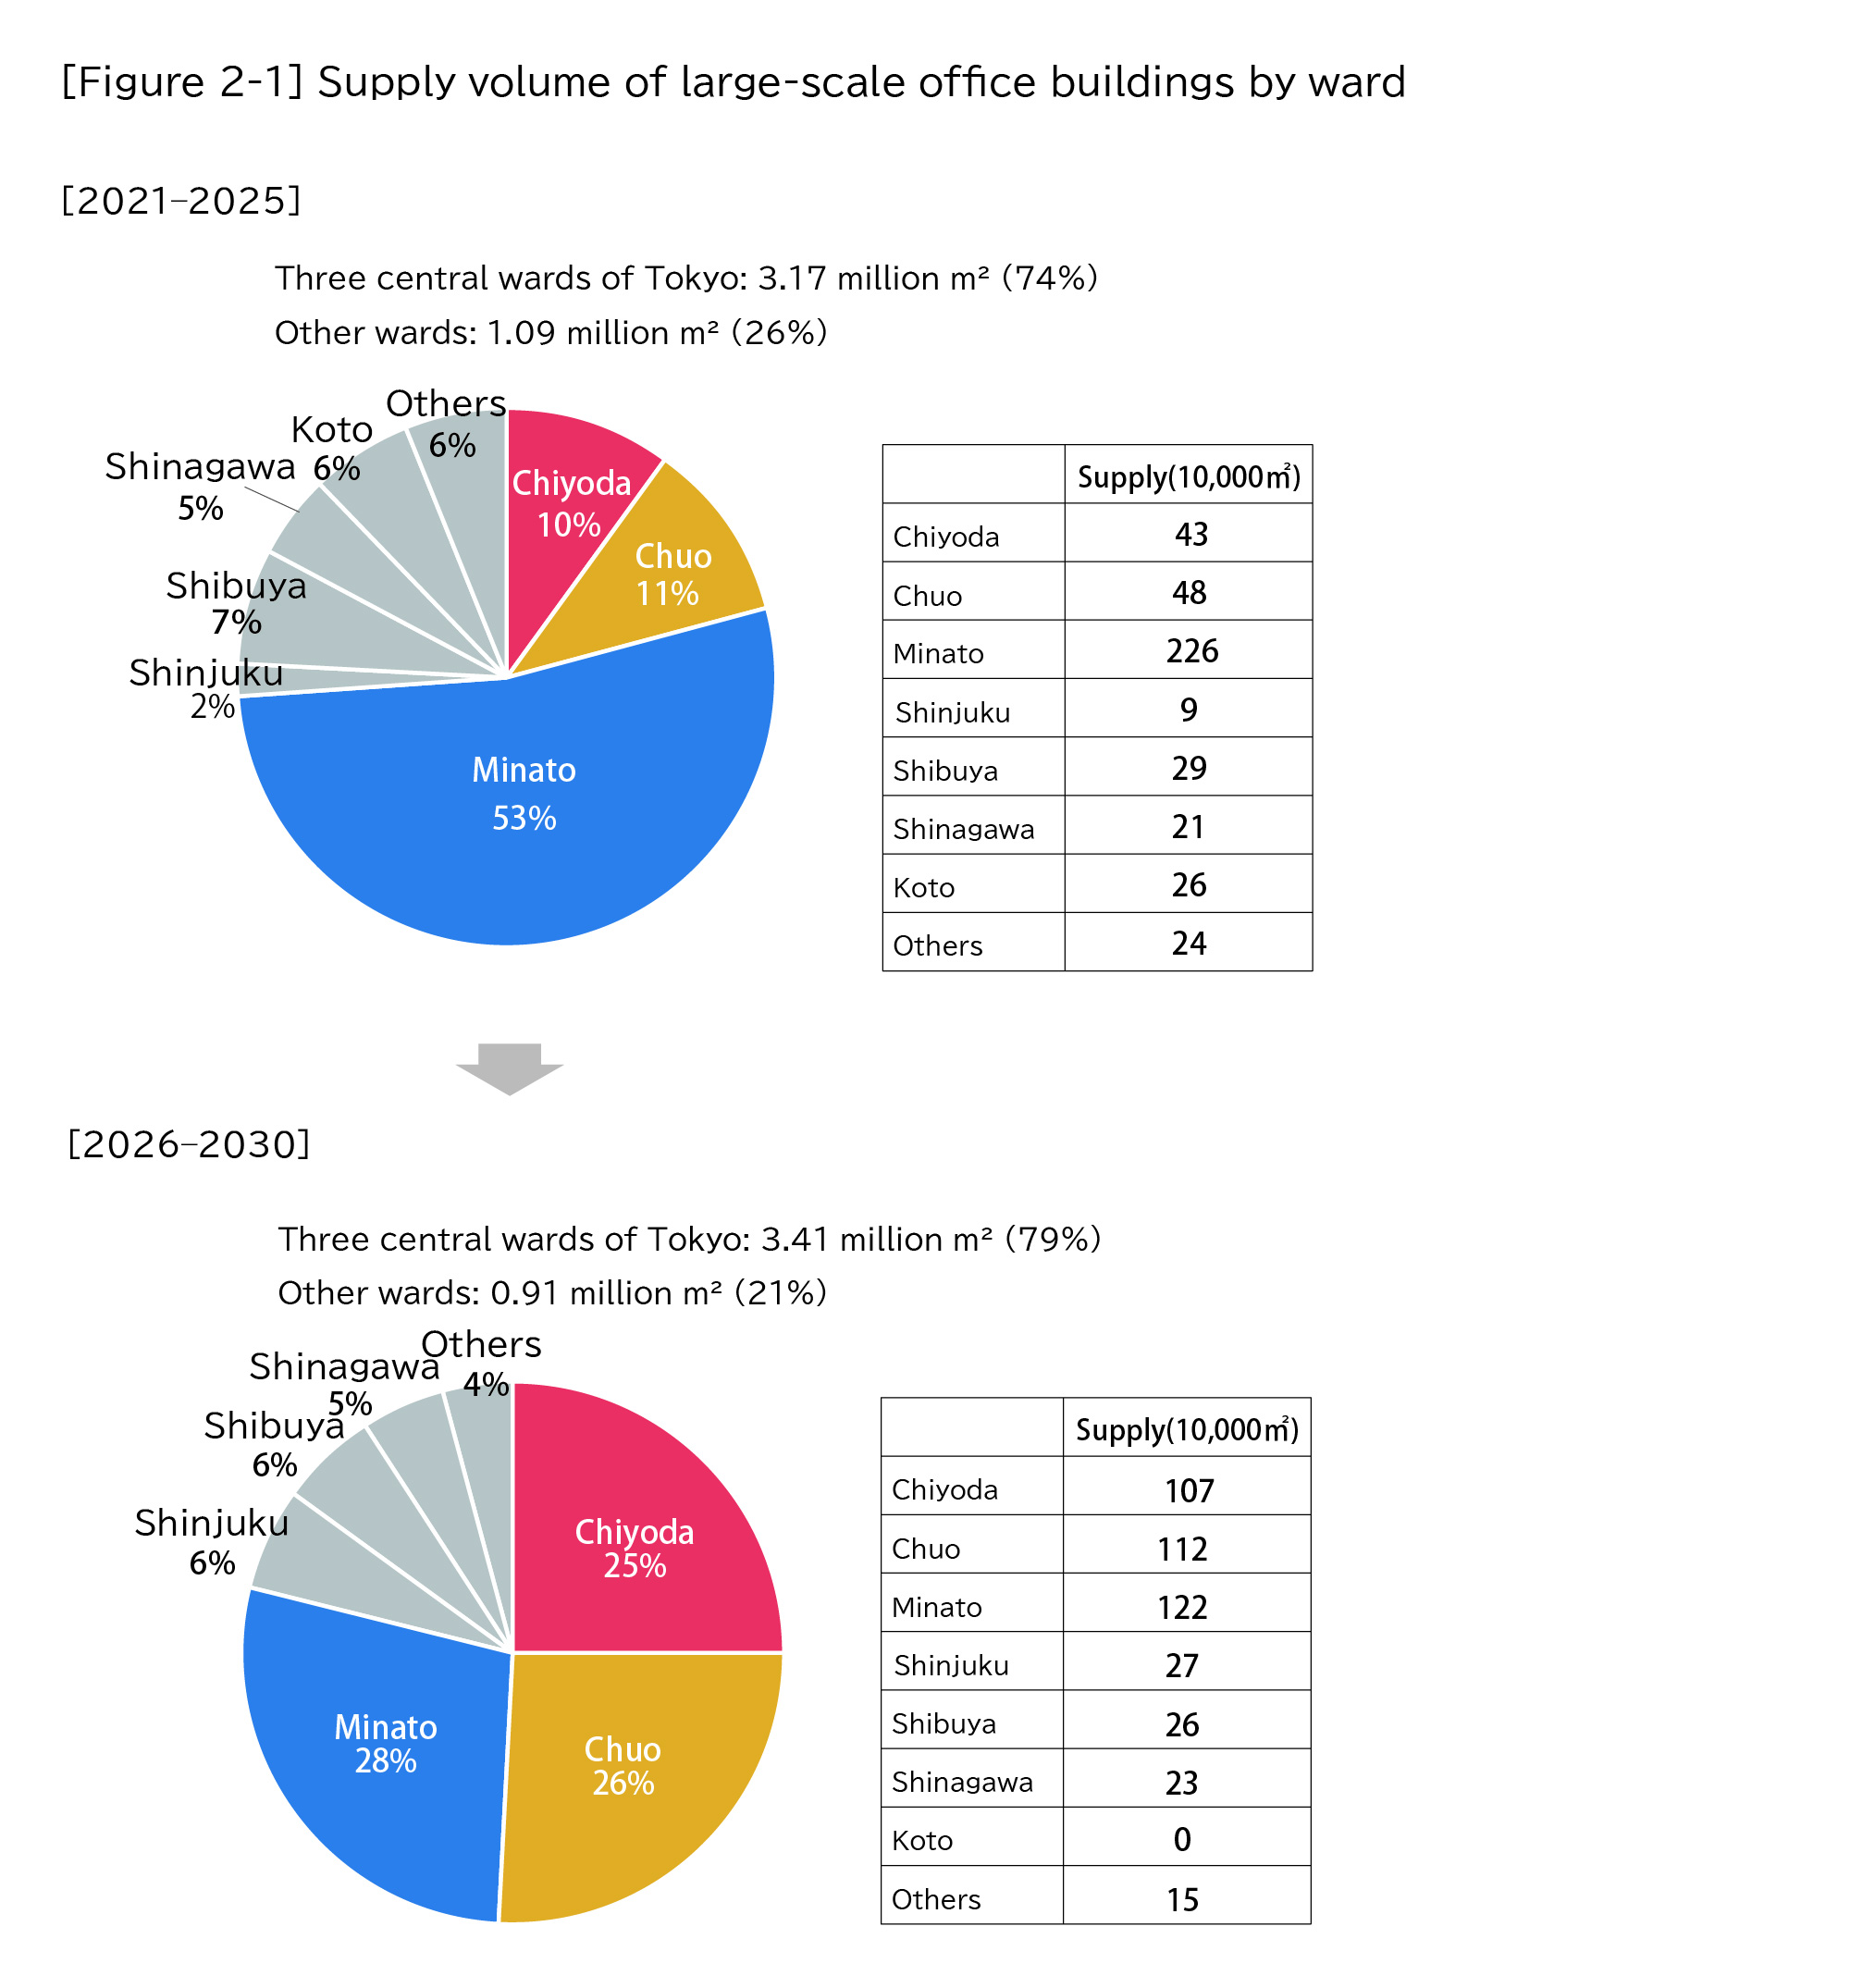
Looking at the supply trends for large-scale office buildings by area, the concentration of supply in the three central wards of Tokyo (Chiyoda, Chuo, and Minato wards), which existed over the past five years (2021 to 2025), is expected to strengthen over the next five years (2026 to 2030).
Looking at the breakdown of the three central wards of Tokyo, Minato ward stood out at 50% from 2021 to 2025, whereas it will be on par with Chiyoda and Chuo wards between 2026 and 2030. Chiyoda and Chuo wards have grown both in terms of supply volume and percentage, thereby driving the higher supply ratio for the three central wards of Tokyo. [Figure 2-1]
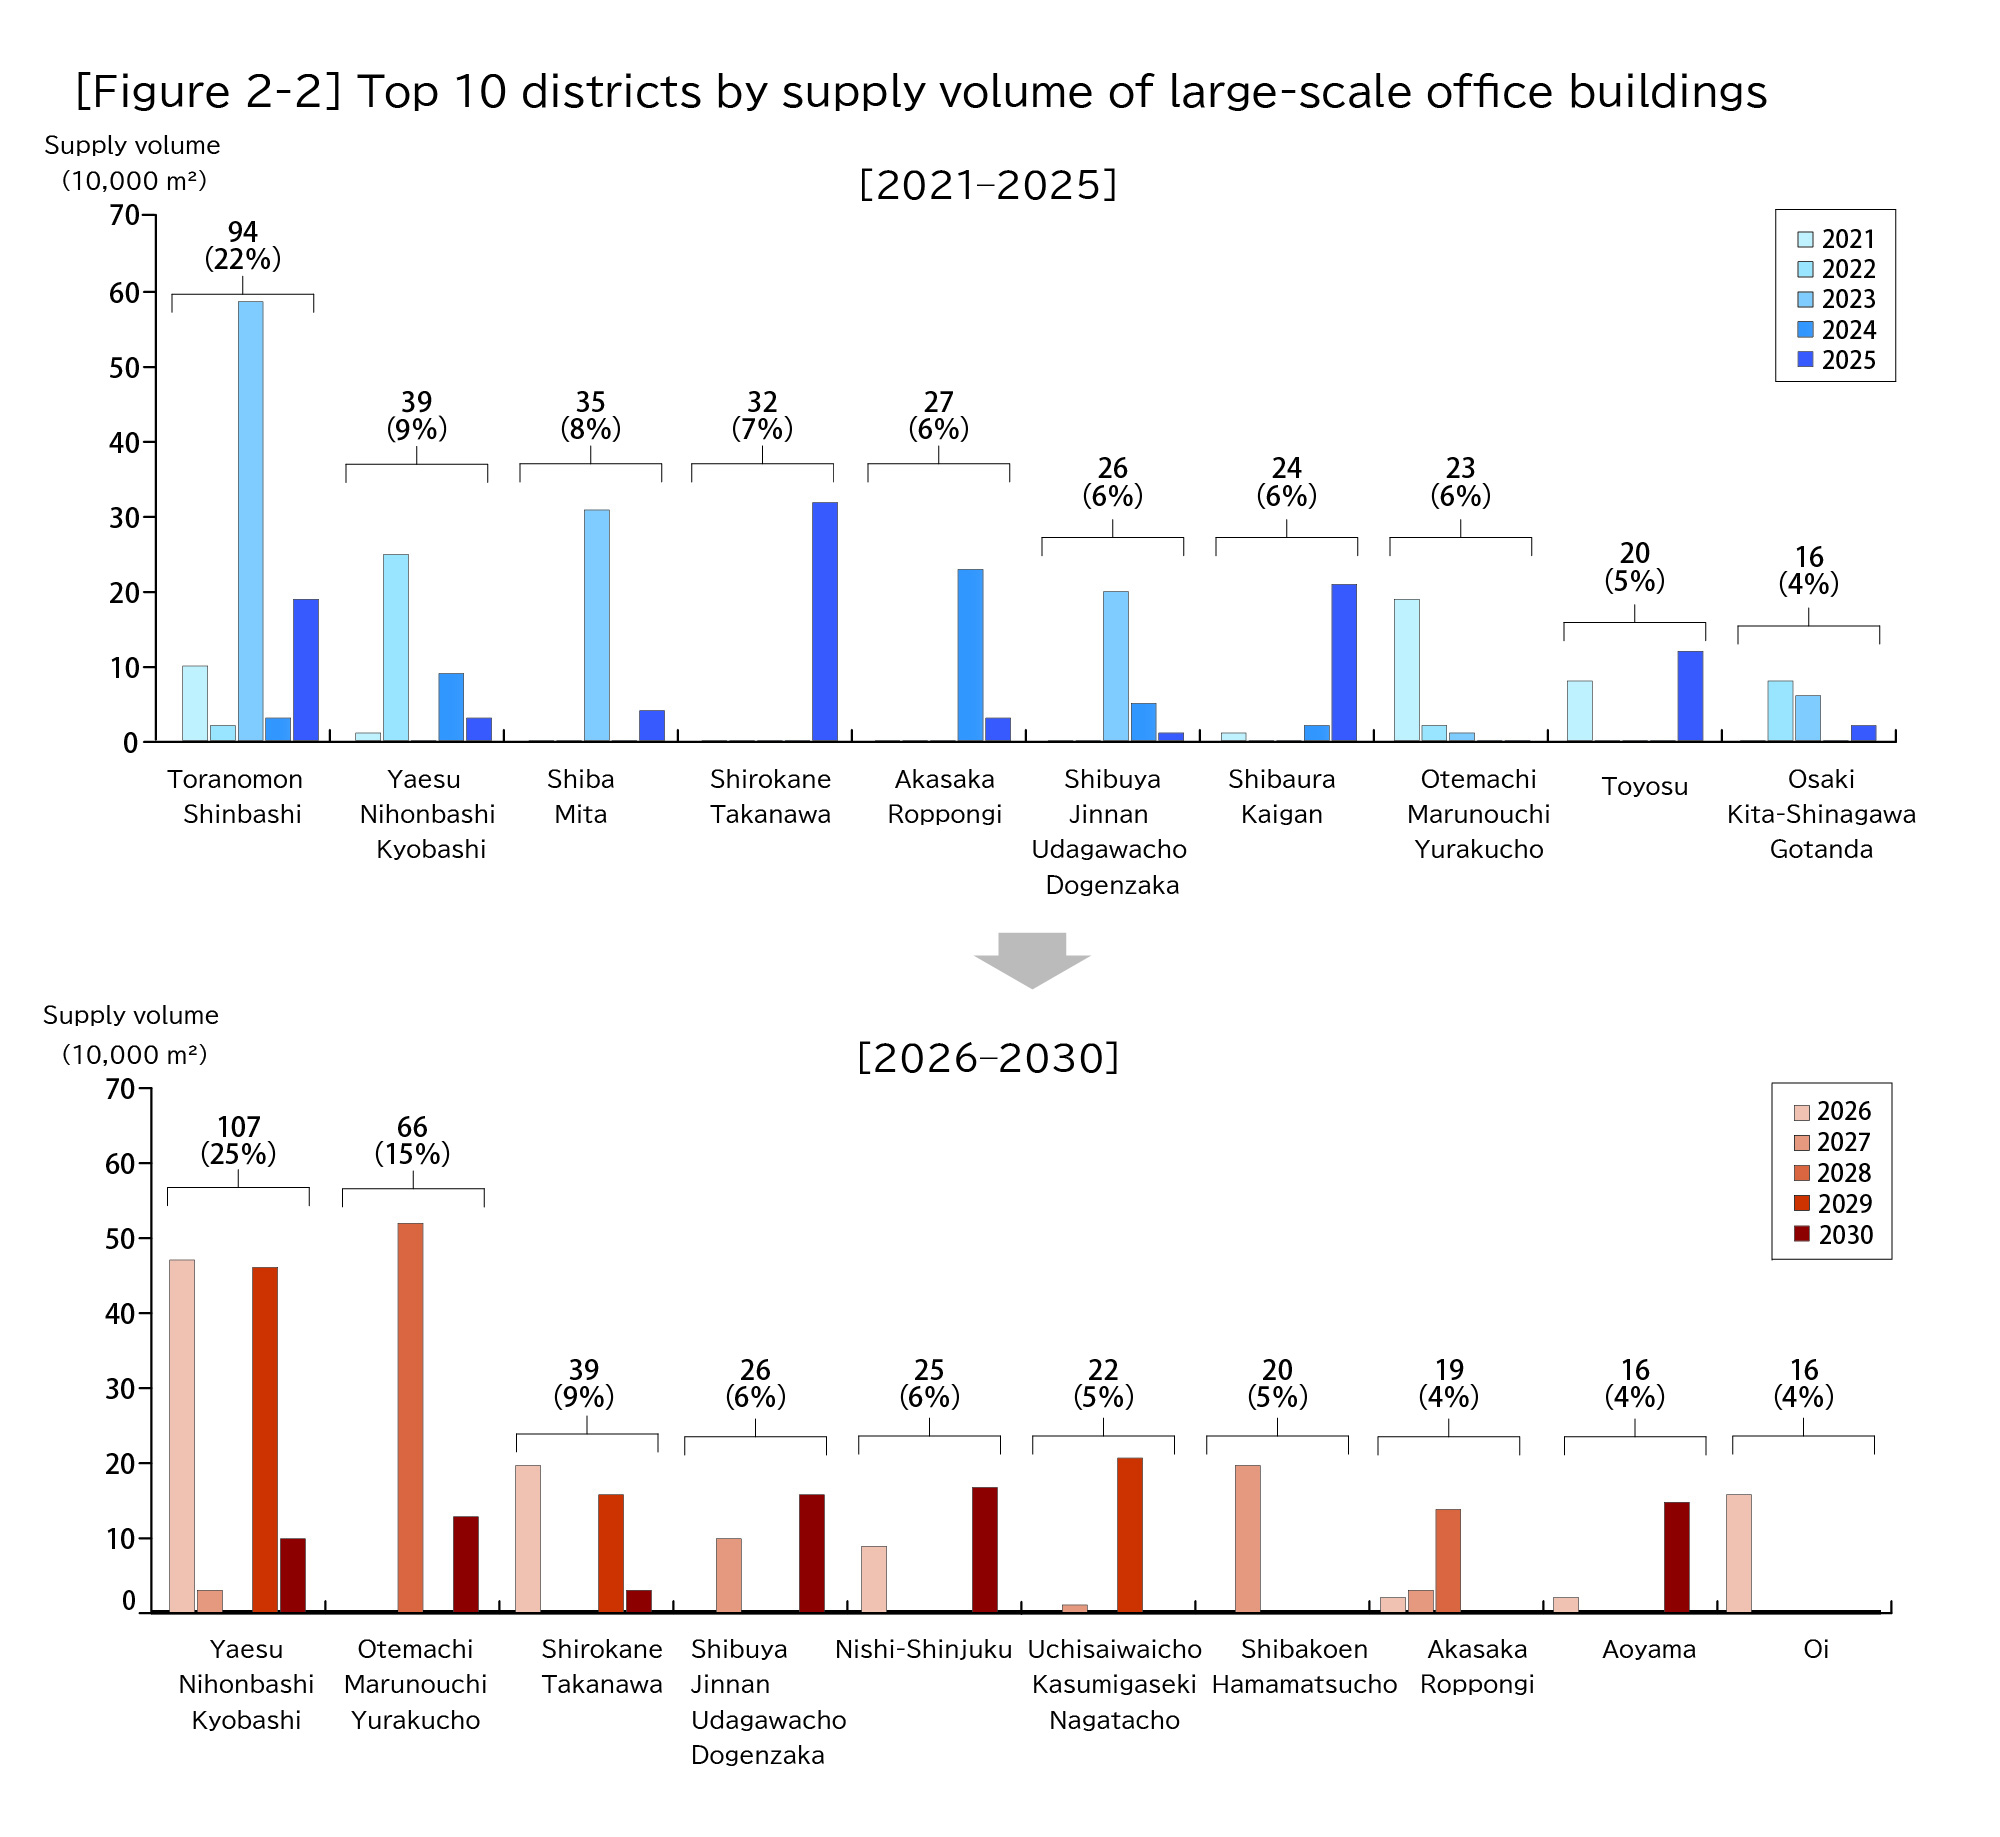
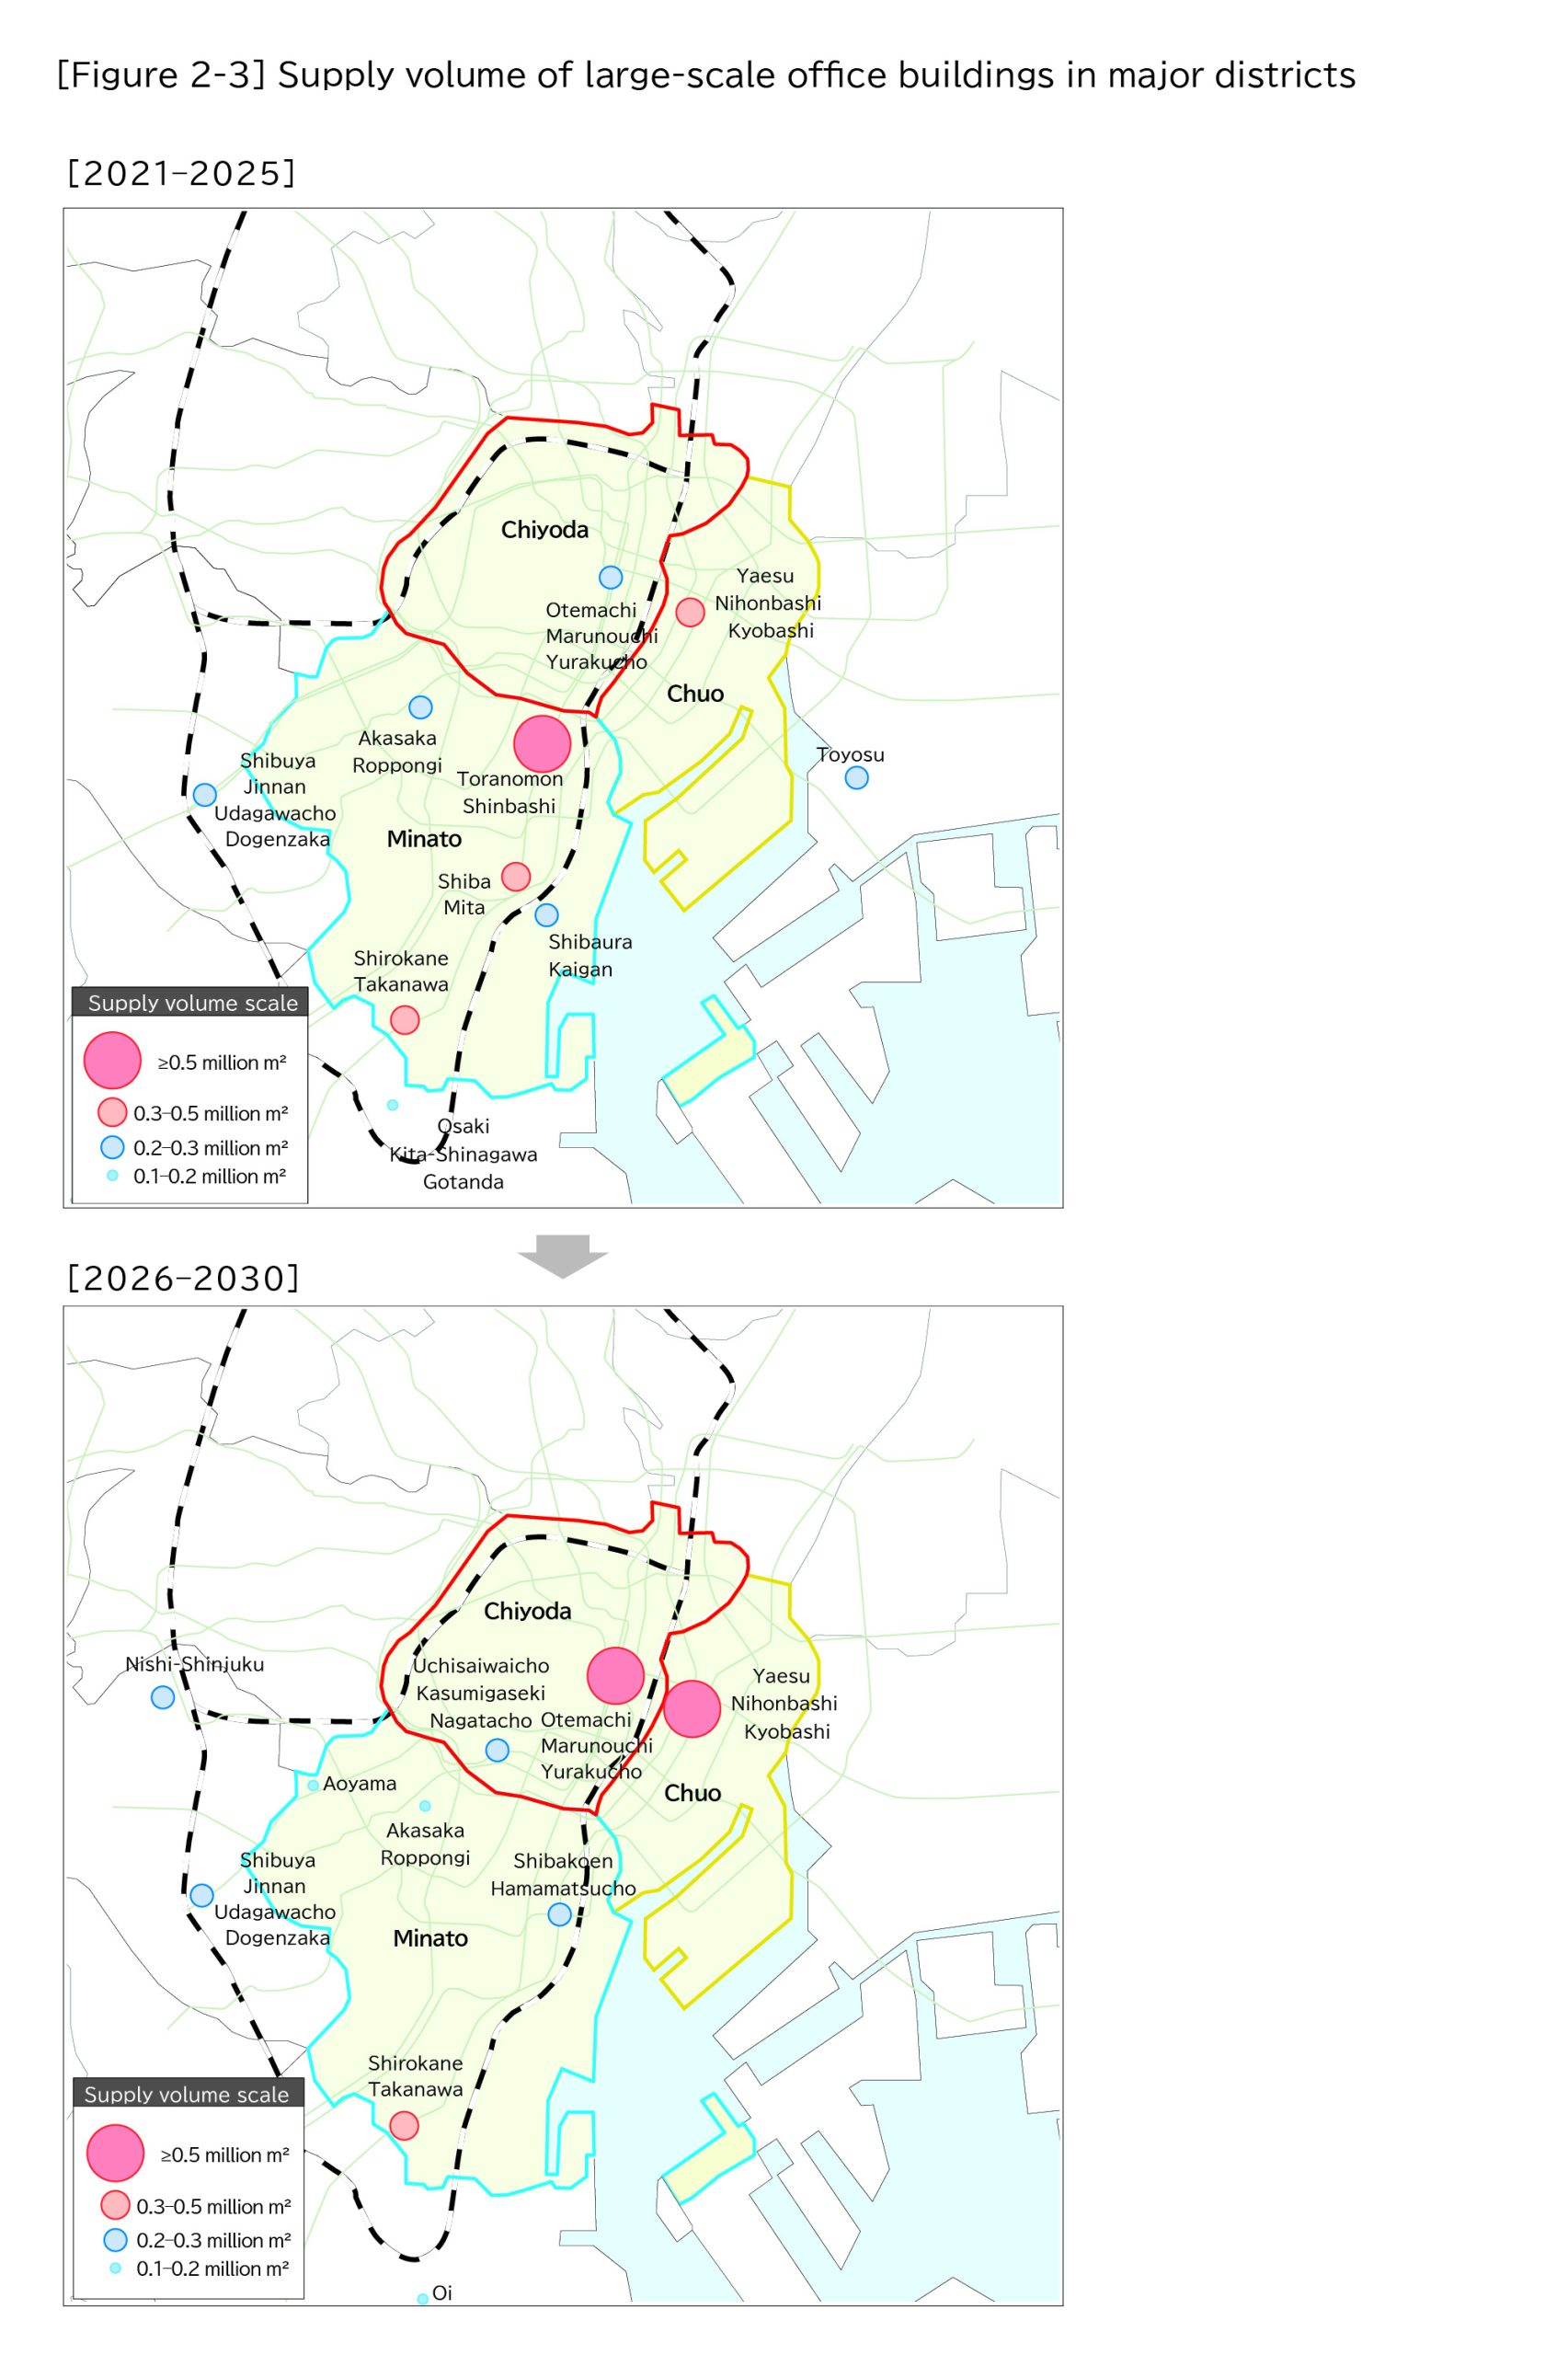
Aggregating changes in supply by district and comparing the top 10 districts reveals changes in the areas where supply is centered. From 2021 to 2025, supply was concentrated in “Toranomon/Shinbashi” and in “Yaesu/Nihonbashi/Kyobashi.” On the other hand, while supply in “Yaesu/Nihonbashi/Kyobashi” will remain high from 2026 to 2030, several areas that were outside the top ten over the past five years, including “Uchisaiwaicho/Kasumigaseki/Nagatacho,” “Nishi-Shinjuku,” “Aoyama,” and “Oi,” newly entered the top ten, leading to an outlook for diversification in development areas. [Figure 2-2] [Figure 2-3]
Looking at the year-on-year rate of change in office floor area (stock) as shown in Reference Data [Figure 5-2] at the end of this report, the rate of decline in stock in Chuo ward in recent years is remarkable, indicating that the demolition of existing buildings is progressing in line with future supply growth.
*Totals for data presented as percentages may not add up to 100% as a result of rounding to the first decimal place.
3. Supply Trends by Development Site
Here, we totaled the supply ratio for each development site category since 2015 on a five-year basis.
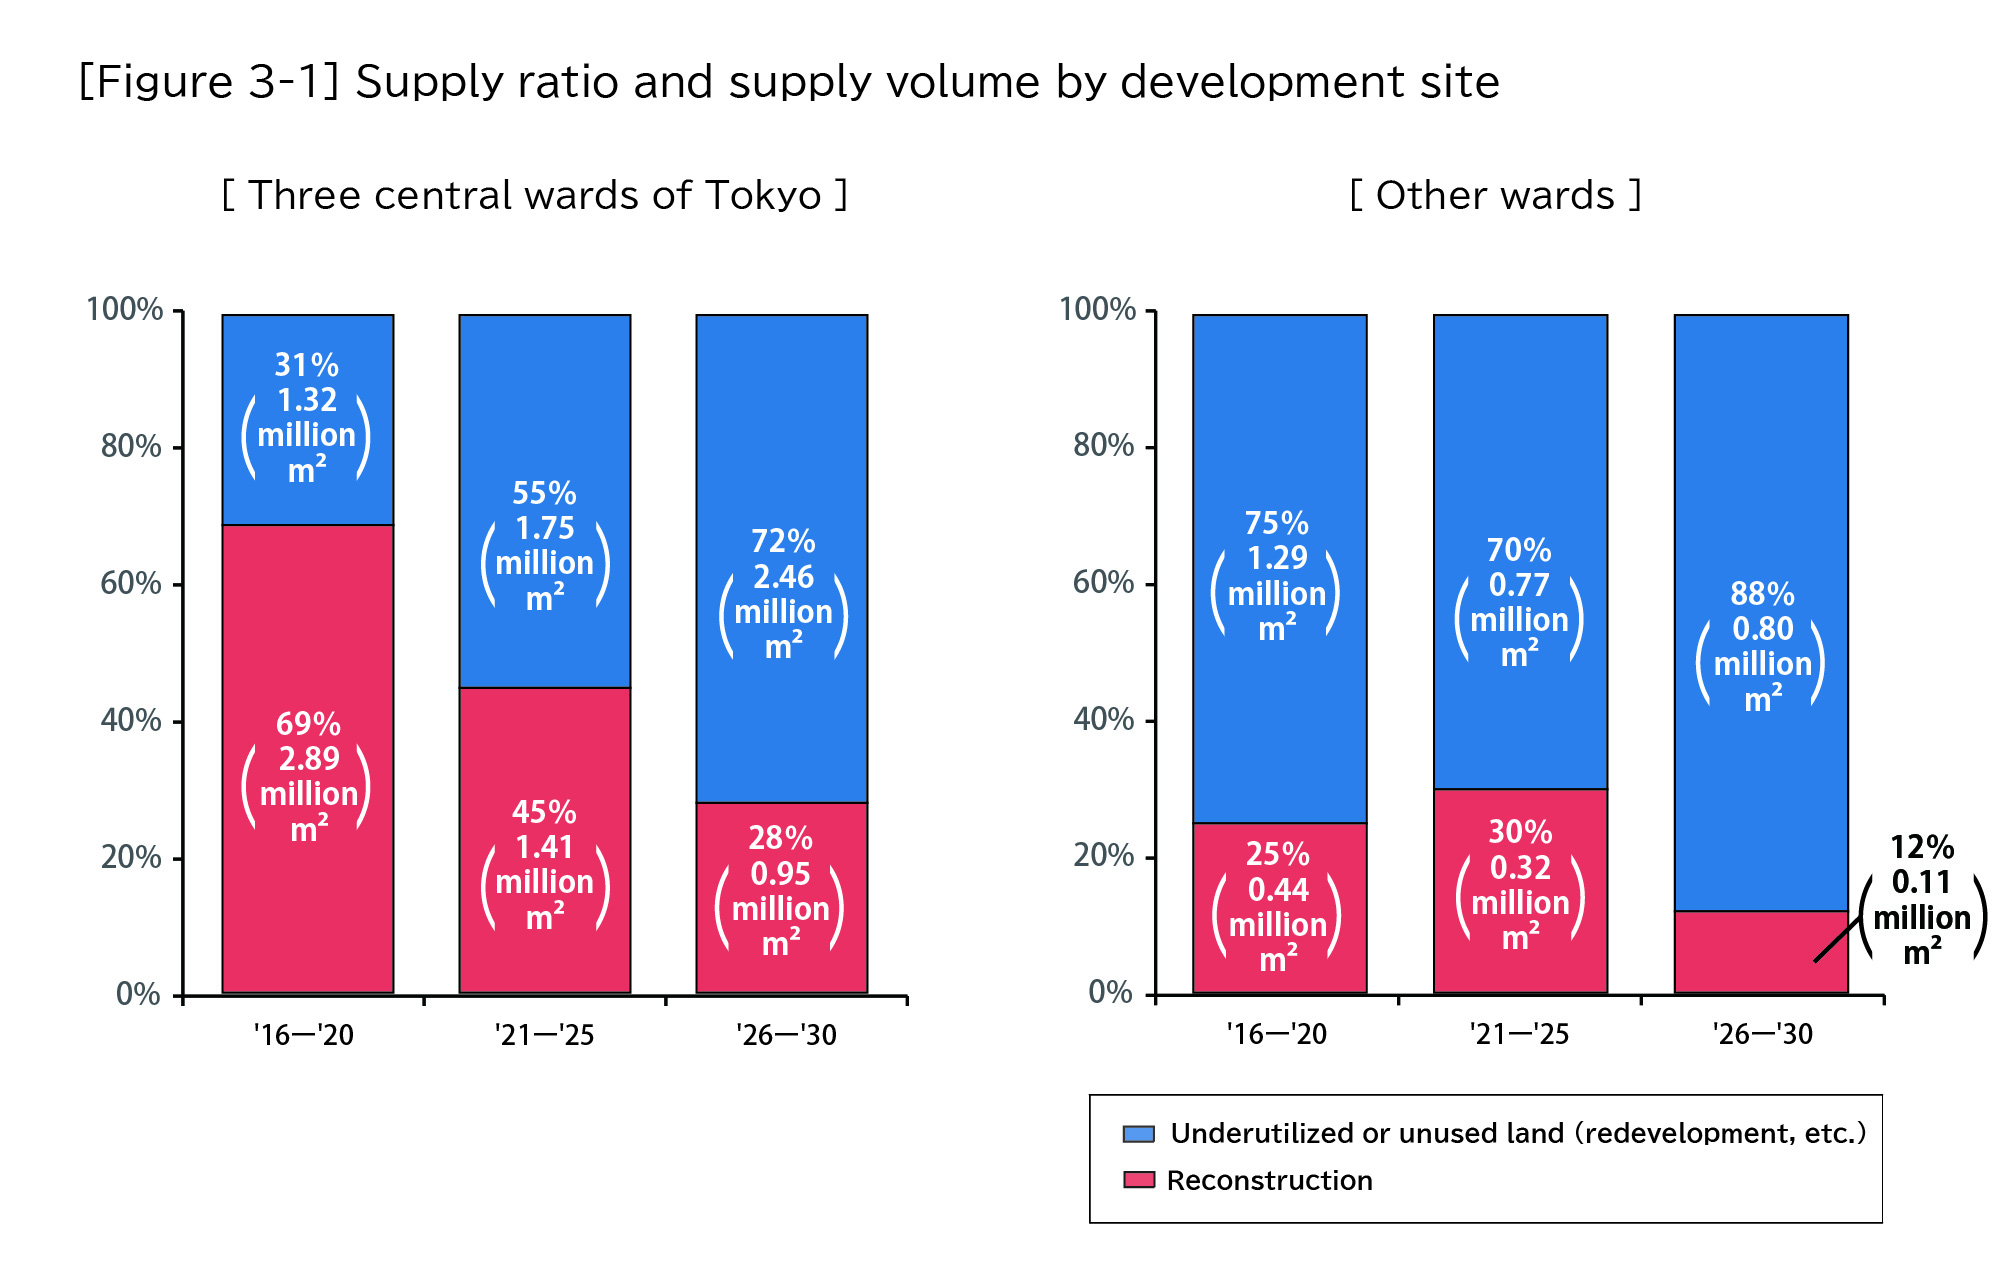
In the three central wards of Tokyo, the ratio of “underutilized or unused land (redevelopment, etc.)” more than doubled from 30% from 2016 to 2020 to 70% from 2026 to 2030, resulting in a shift in the focus of development sites from “reconstruction” to “underutilized or unused land (redevelopment, etc.).”
On the other hand, outside the three central wards of Tokyo, “underutilized or unused land (redevelopment, etc.)” has consistently been the main focus of development from 2016 to 2020, and beyond.
In this way, the supply of large-scale office buildings is dominated by “underutilized or unused land (redevelopment, etc.)” regardless of whether it is inside or outside the three central wards of Tokyo. [Figure 3-1]
[Definitions of terms]
Reconstruction: Development on the site of a building that was previously used as some combination of an office, hotel, or residential building.
Underutilized or unused land: Development of land intended for high-level use in the form of groupings of small buildings, etc., land that is currently developed with a sporadic mix of parking lots and older buildings, and land that has not been used effectively, such as dense residential areas, former factory sites, railway sites, and idle land.
4. Medium-scale Office Building Supply Trends
The supply of medium-scale office buildings in 2025 was 99,000 m2, on a par with the average supply of 98,000 m2 over the past 10 years. On the other hand, in 2026 supply reached its lowest level of 44,000 m2 for the years covered by this survey, while the average supply over the next two years will be 66,000 m2, less than the average over the past 10 years. In 2027, however, supply will rebound to 88,000 m2, so we will closely monitor future trends. [Figure 4-1]
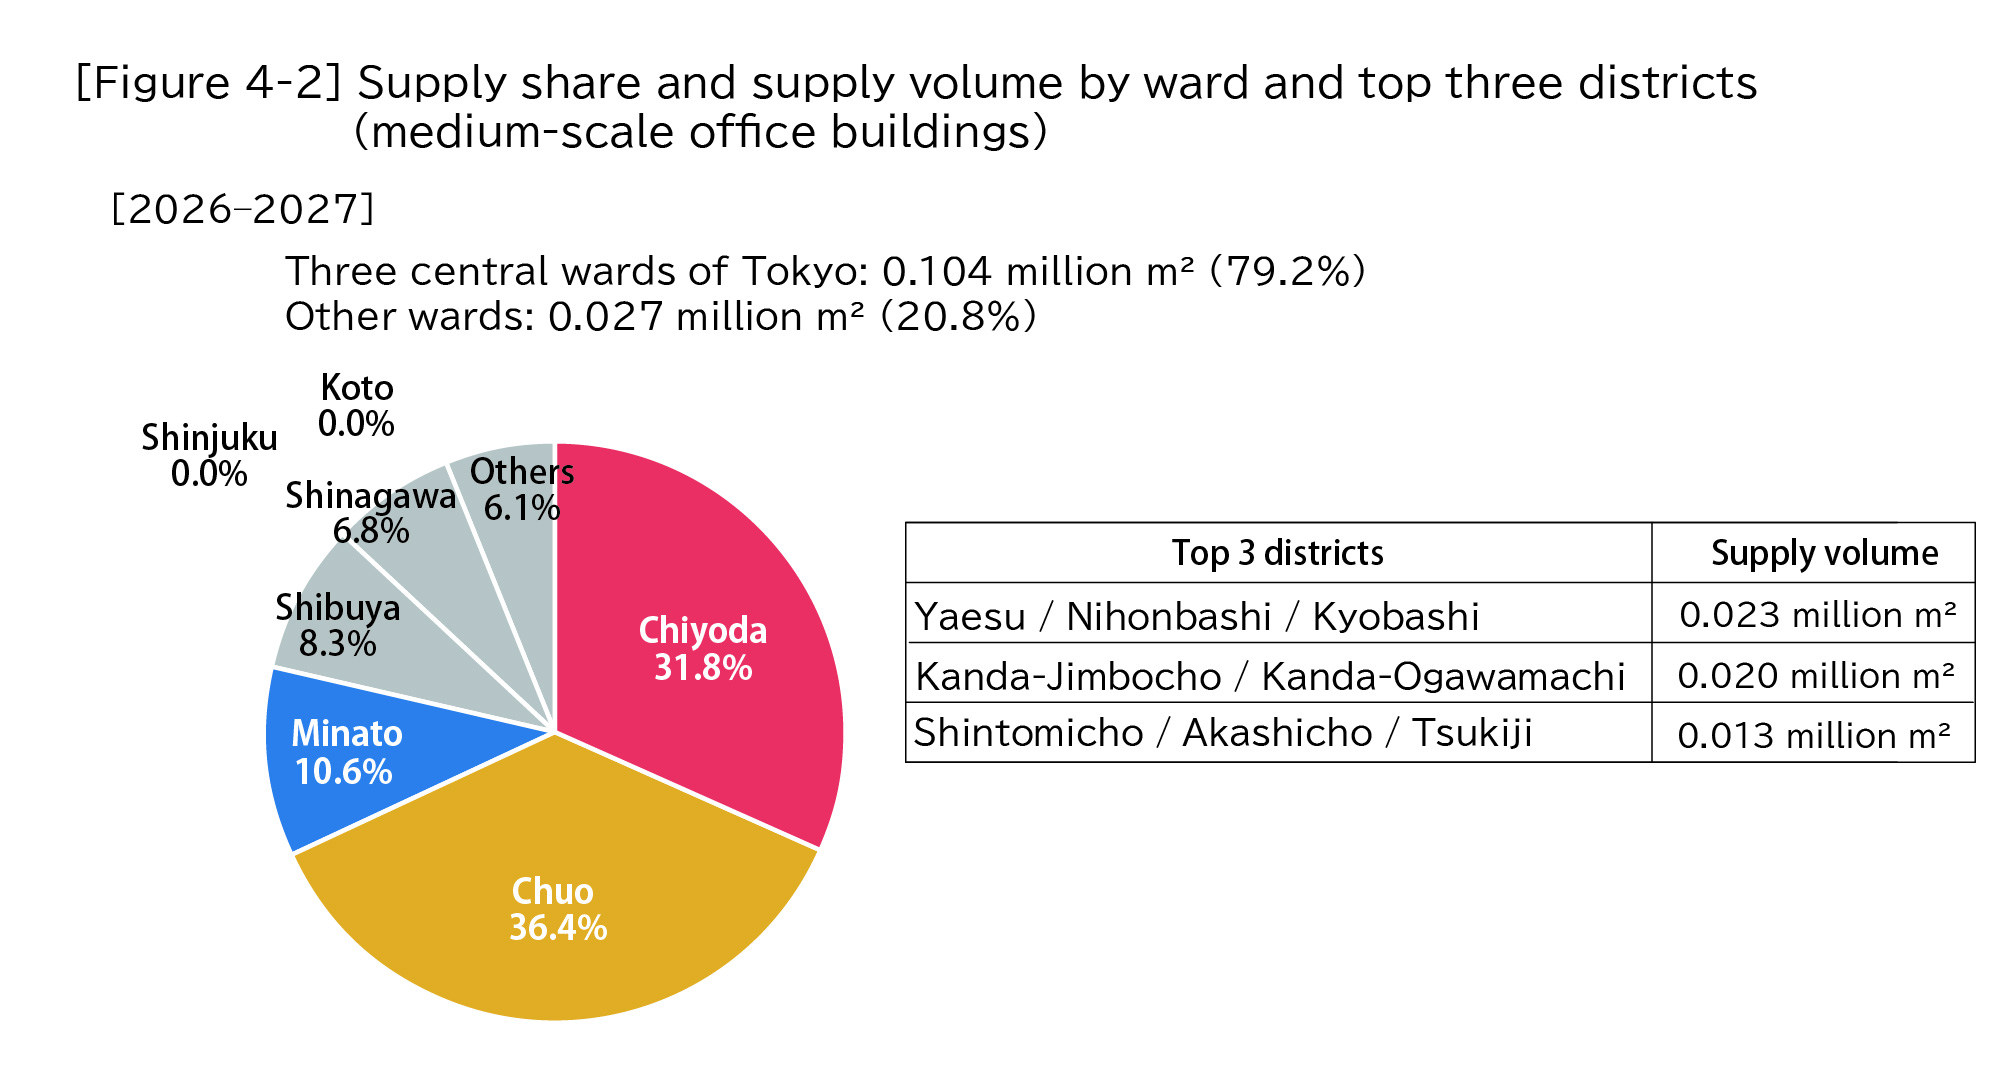
Looking at the supply ratio by ward for 2026 and 2027, the three central wards of Tokyo will account for about 80% of supply. In particular, Chiyoda and Chuo wards, which account for about 70% of the total, are the core areas for medium-scale office building supply. [Figure 4-2]
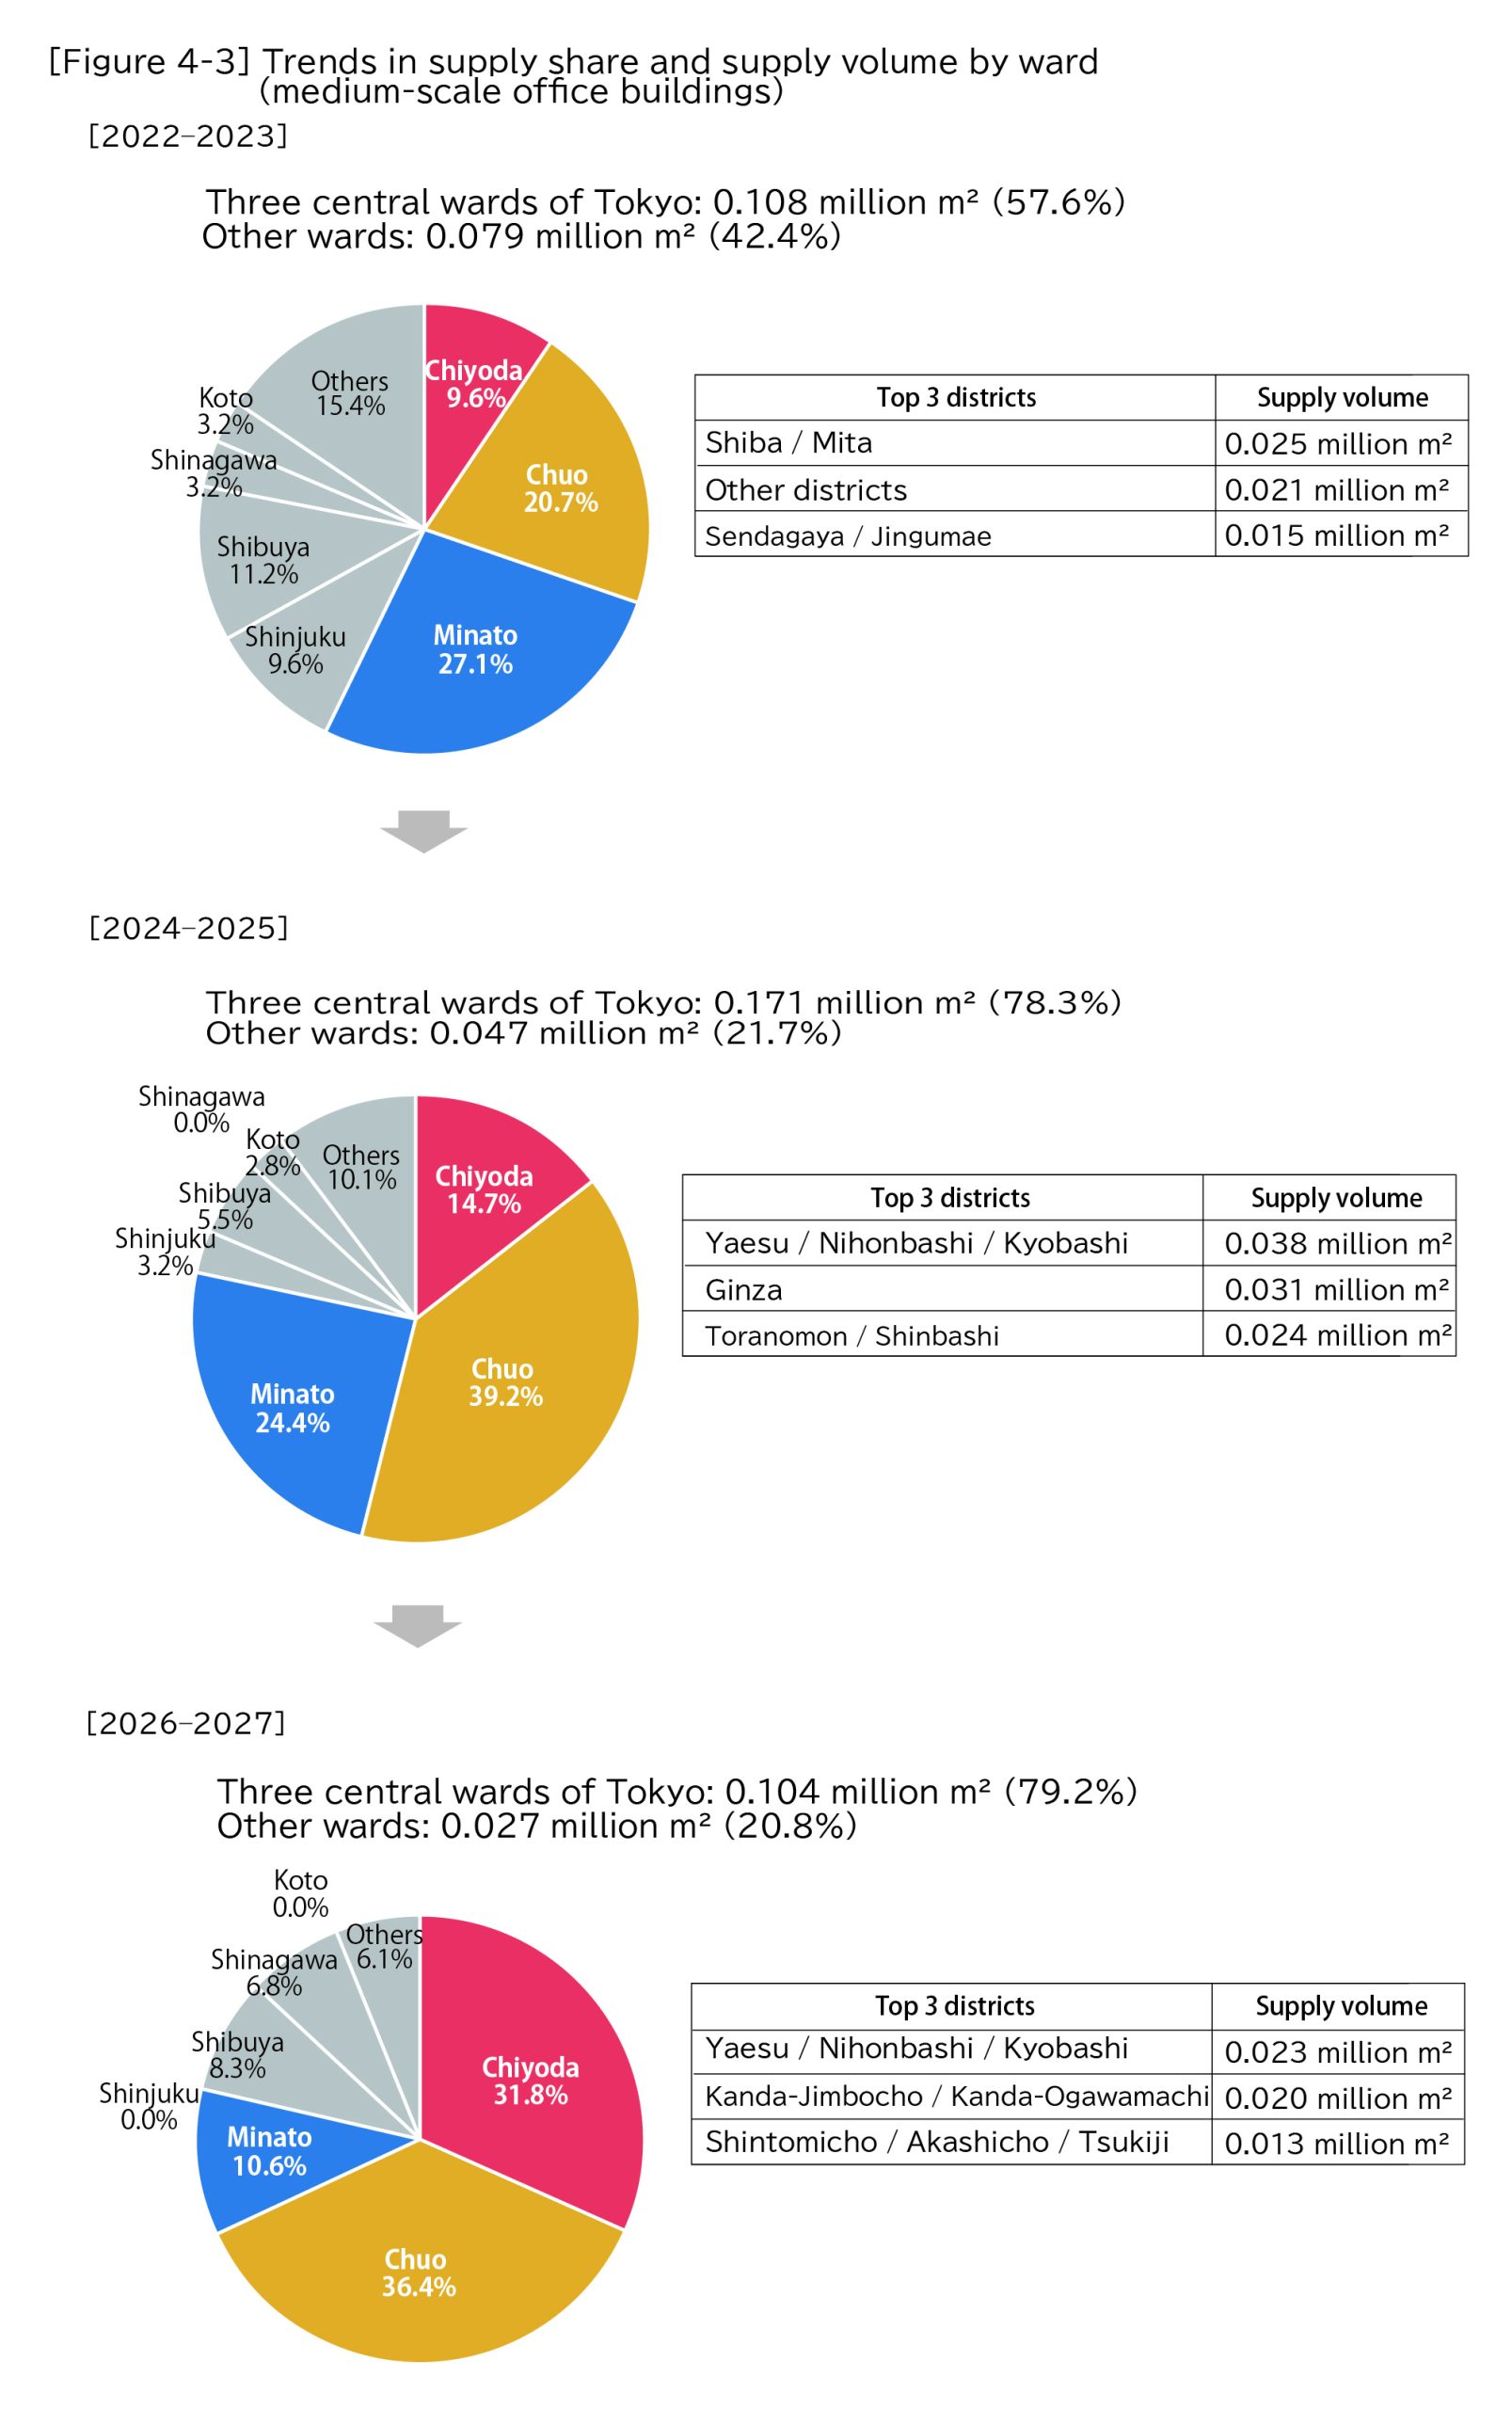
When supply is aggregated by ward on the basis of two-year periods starting in 2022 and tracked, the supply ratio for the three central wards of Tokyo has steadily trended upwards. Looking at the breakdown of the three central wards of Tokyo, although the ratio for Minato ward has declined, that for Chiyoda and Chuo wards has increased. This trend is therefore considered to be similar to that for large-scale office buildings by ward. [Figure 4-3]
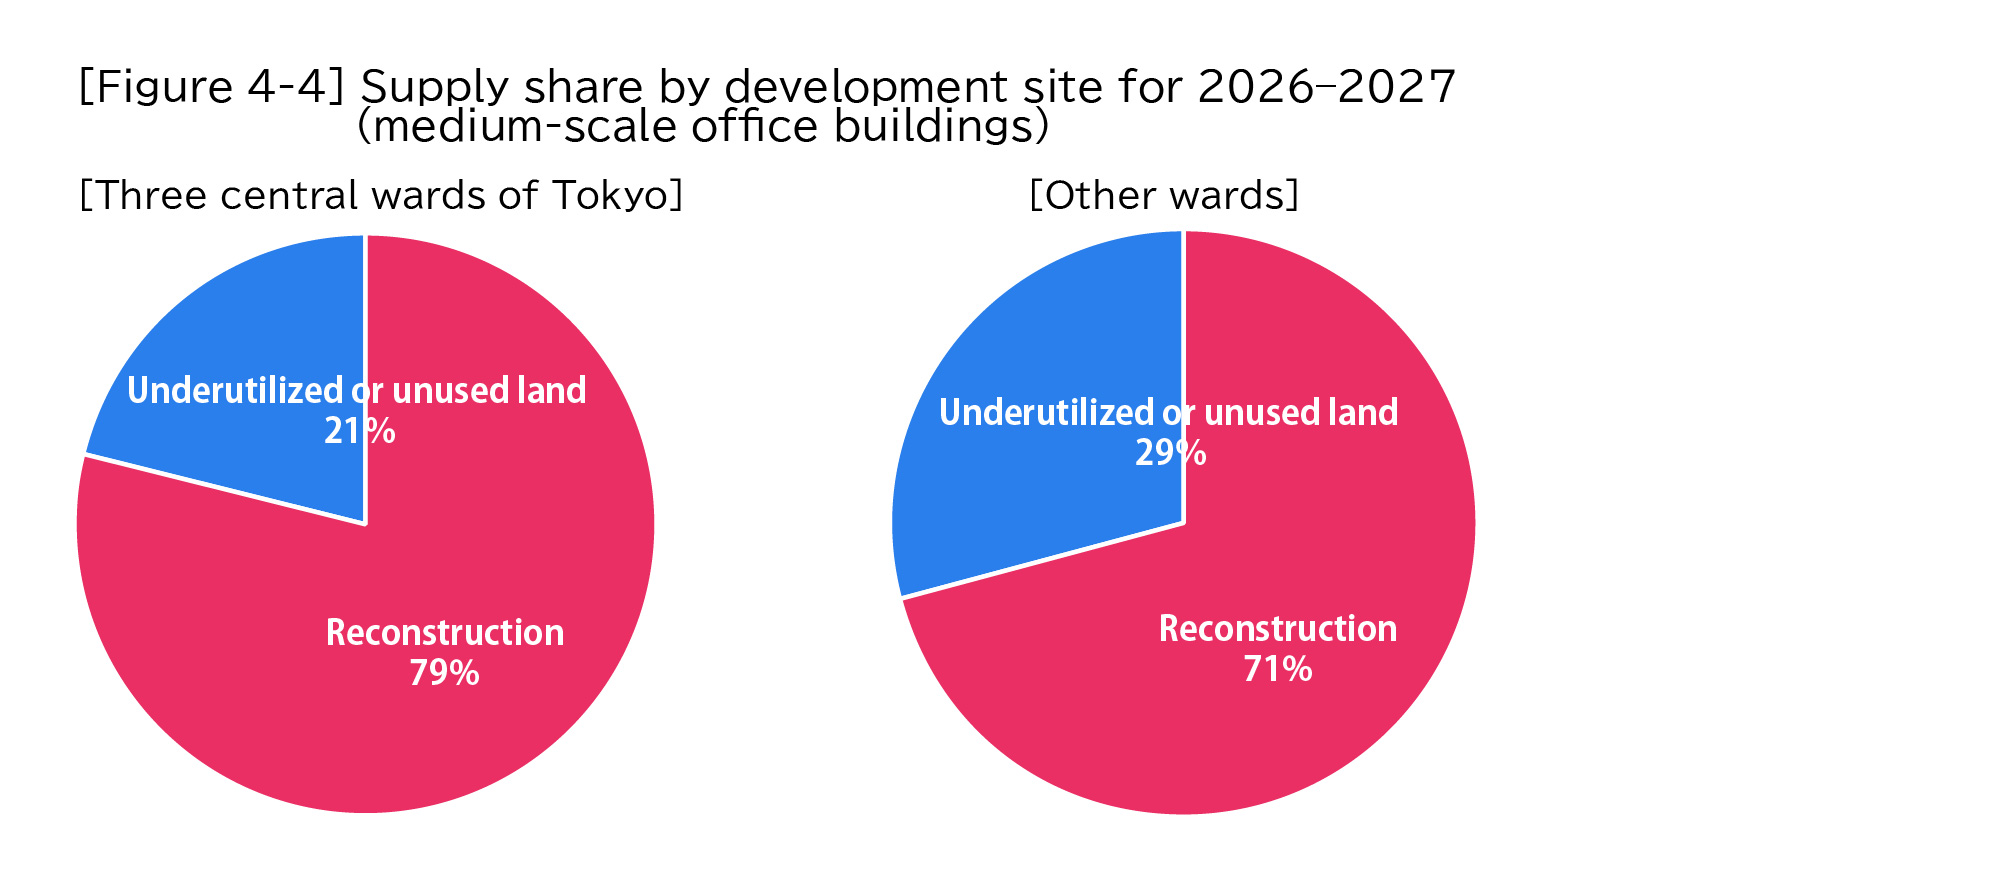
Looking at the supply trend for medium-scale office buildings by development site category, “reconstruction” is the predominant category both inside and outside the three central wards of Tokyo, which differs from the trend for large-scale office buildings, for which “underutilized or unused land” is the main category. [Figure 4-4]
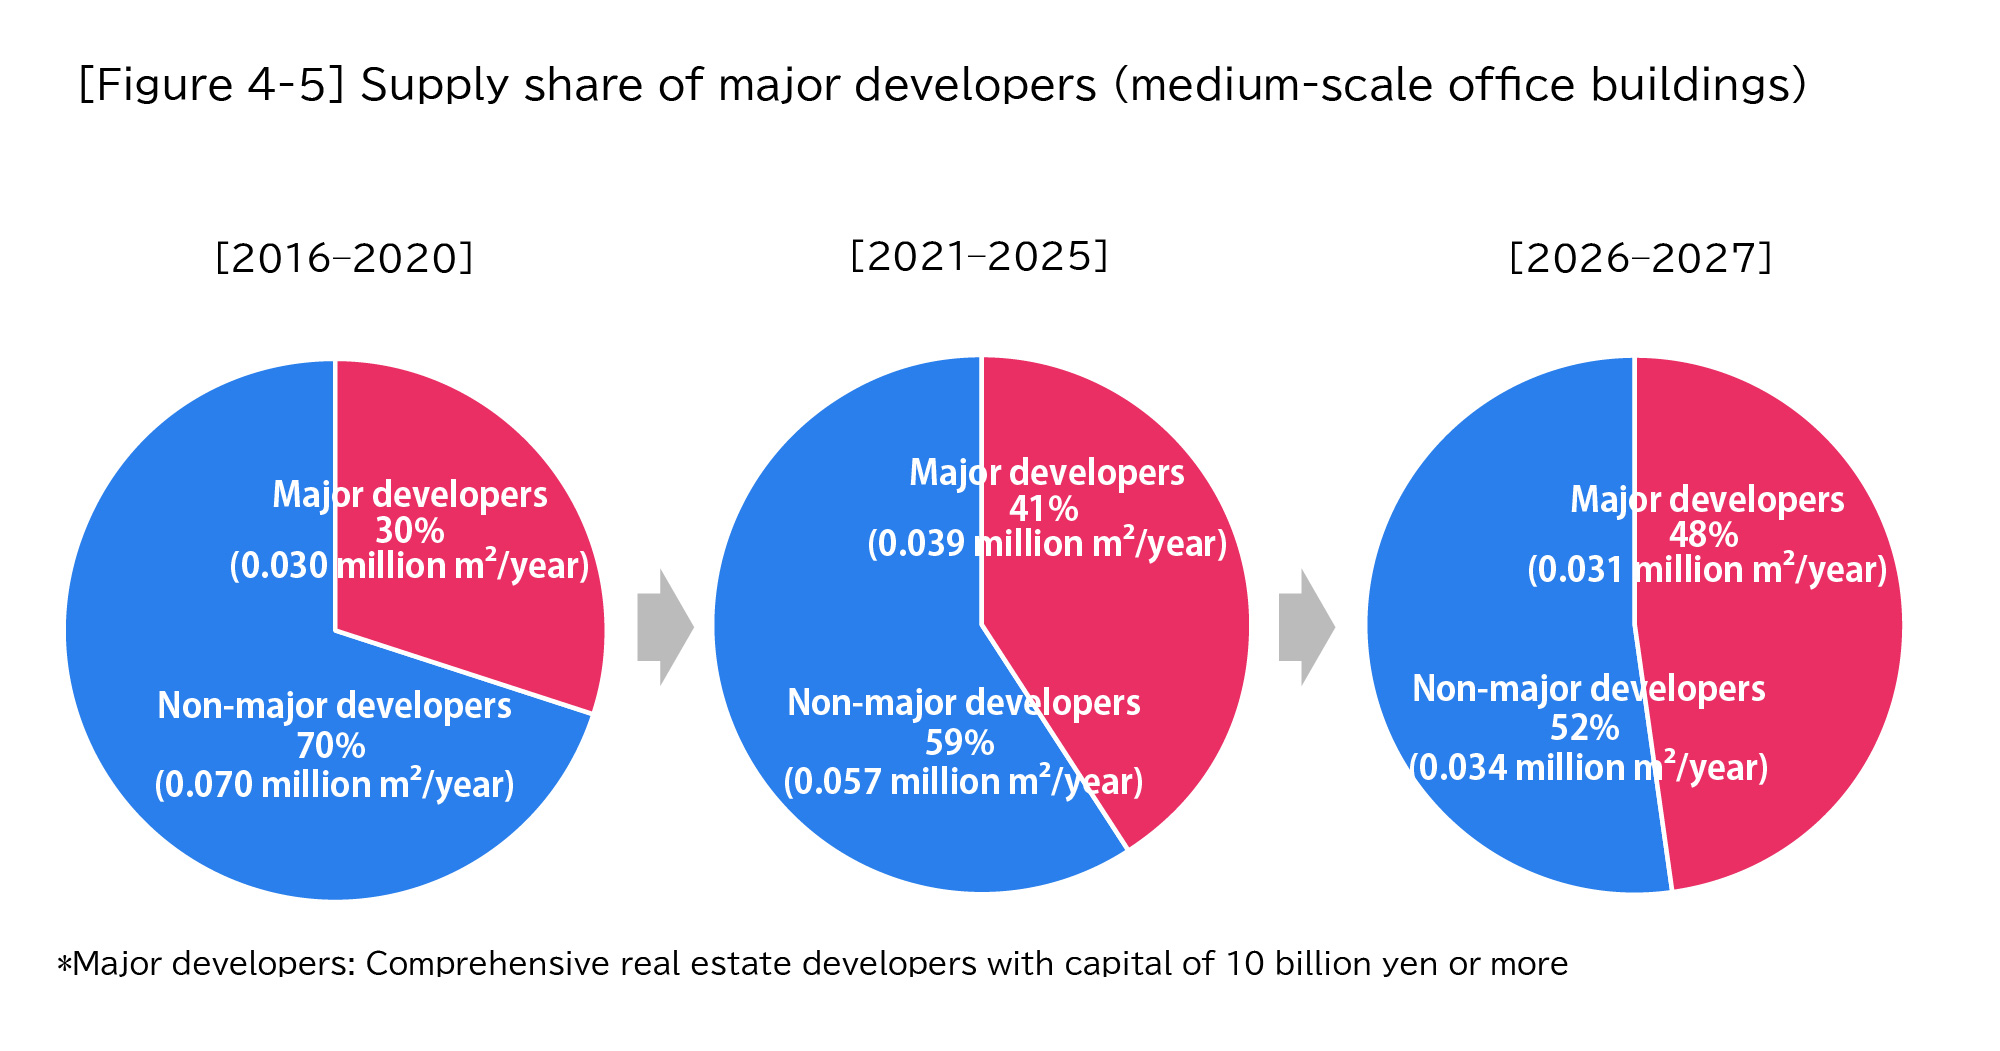
Looking at project leads for medium-scale office buildings, although the ratio accounted for by major developers was about 30% from 2016 to 2020, this trend has been strengthening in recent years, rising to nearly 50% in 2026 and 2027. [Figure 4-5]
*Totals for data presented as percentages may not add up to 100% as a result of rounding to the first decimal place.